

Barley is the major grain used for the production of malt. Improvement of malting quality has been a major task of barley workers. Malting quality is attributed to the interaction of enzymes and their substrates during malting and mashing. Malting quality, controlled by quantitative trait loci (QTL), is composed of a number of traits including percentage of malt extract, total grain protein, wort protein, beta-glucan and kernel plumpness, alpha-amylase activity, kernel weight and diastatic power. The standard method of assessing malting quality in breeding programs by micromalting and micromashing is time-, resource- and labor-intensive. Feasible and efficient approaches for identifying genotypes with good malting quality are badly needed. With the advent of molecular markers, it is possible to map the loci affecting malting quality and then tag them with tightly linked markers. This report focuses on: i). resolution of QTL associated with malting quality traits, and ii). overlapping QTL as determined in a "Steptoe"/"Morex" cross by the North American Barley Genome Mapping Project (NABGMP). The initial map (Kleinhofs et al. 1993) and first year (1991) QTL analyses (Hayes et al. 1993; Ullrich et al. 1993) have been published.
Materials and Methods
A population of 150 doubled haploid (DH) lines were derived by a modification of the Hordeum bulbosum method (Chen and Hayes 1989) from the FI of the cross of Steptoe and Morex. The population has been used to construct a 295-point map with an average density of 4 cM (Kleinhofs et al. 1993). By selecting relatively evenly spaced markers, a 129-point "skeleton" linkage map was generated by using GMENDEL (Liu and Knapp 1990).
The 150 DH lines and the parents were evaluated in field experiments at Aberdeen, Idaho; Bozeman, Montana, Klamath Falls, Oregon, and Pullman, Washington in 1991, and at Tetonia, Idaho; Crookston, Minnesota; Bozeman dryland and irrigated, Montana; and Pullman, Washington in 1992. At each location, plot size and management were in accordance with local practice. A randomized complete block design with partial (1991) and full (2) (1992) replications was employed at each location. Malting quality traits were measured on a composite 400-g sample of each DH line and parents following the standard procedures employed by the USDA/ARS Cereal Crops Research Unit, Madison, Wisconsin.
QTL analyses were performed using QTL-STAT; an interval mapping program that uses non-linear models (B.H. Liu and S.J. Knapp, unpublished). QTL effects were considered significant if they exceeded a Wald statistic of 10.0 (p<=.001). These analyses follow-up on the initial report of 1991 data only (Hayes et al. 1993).
Results
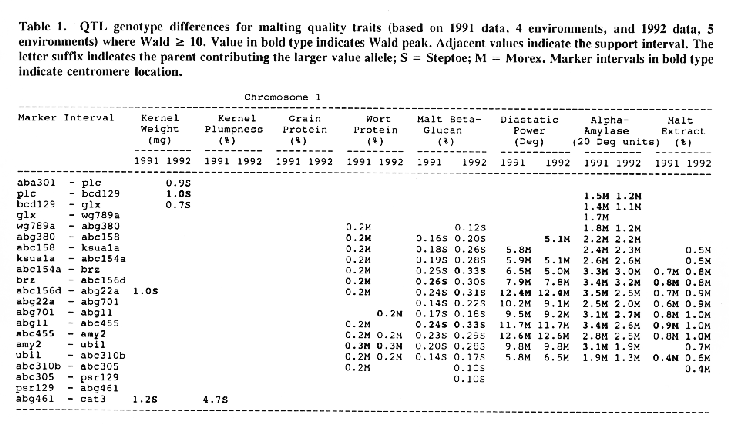
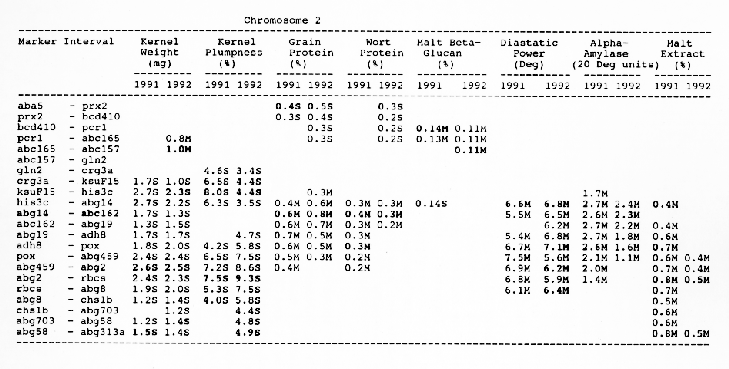
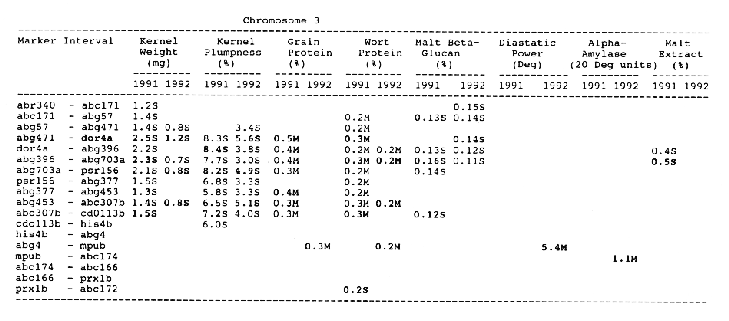
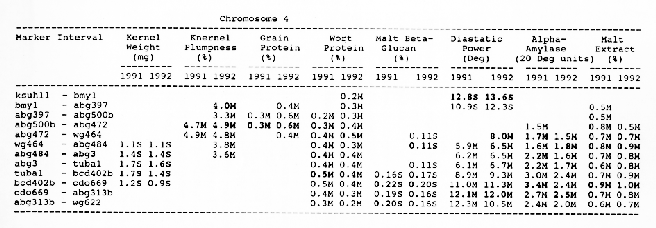
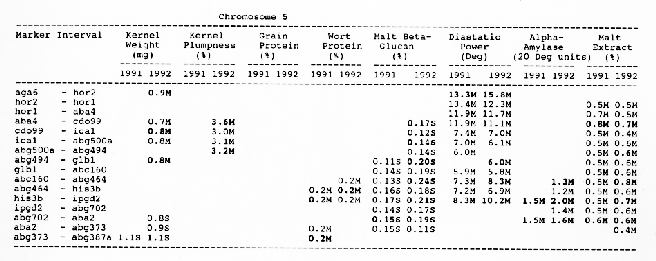
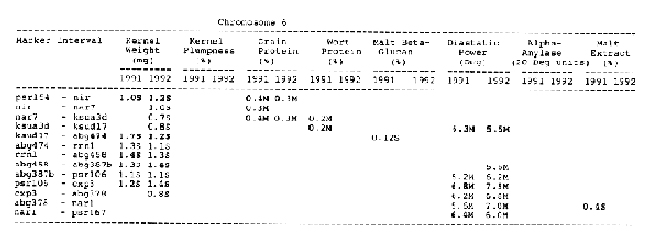
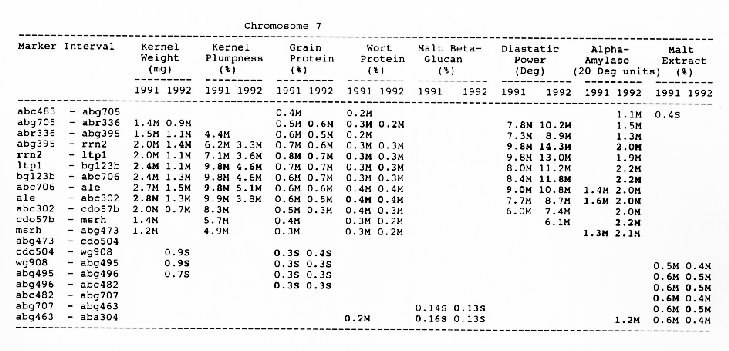
Average QTL effects exceeding the Wald >= 10.0 threshold were found for all characters at multiple sites throughout the genome. Table I shows the difference between QTL genotypes, expressed in the units at the head of each column, for the support interval surrounding each Wald-peak (indicated in bold). The letter suffix denotes the parent (Steptoe or Morex) contributing the allele with the larger value. Results will be presented as follows using the information found in Table 1.
Resolution of QTL for each trait
Kernel weight: The most consistent QTL over the two years were those on chromosomes 2, 4, 6 and 7. There were two QTL with the largest and most consistent effects in the ksuF15 - abg14 and ab- 459 - abg2 intervals on chromosome 2. The degree of QTL effects on chromosomes 3 and 7 showed difference between 1991 and 1992. The QTL on chromosome I presented on different sites between two years. On chromosome 5, three Wald peaks appeared in 1992, but not in 1991. Most unfavorable alleles were contributed by Steptoe, while several on chromosomes 2, 5, and 7 were from Morex.
Kernel plumpness: Wald peaks were quite distinct and consistent over 1991 and 1992. Based on these distinct Wald peaks, eight QTL were identified in the ksuF15 - his3c and abg2 - rbcs ntervals on chromosome 2, abg471 - abg396, abg703a - psr 156 and abg453 - cdo I 13b intervals on chromosome 3, abg500b - abg472 interval on chromosome 4 , and ltpI - bg123b and abc706 - ale interval on chromosome 7. No QTL was found on chromosome 6. Two QTL on chromosome 5 only appeared in 1992. One QTL on chromosome I only appeared in 1991. The negative alleles of QTL on chromosomes 1, 2 and 3 were contributed by Steptoe, while the negative alleles; of QTL on chromosomes 4, 5 and 7 were contributed by Morex.
Grain protein: There were no QTL on chromosomes I and 5. On chromosome 2, a QTL whose favorable allele was contributed by Steptoe, was in the aba5 - prx2 interval, and a QTL whose favorable allele was contributed by Morex, was in the abgl4 - adhg interval. Three QTL were found on chromosome 3, but two of these appeared only in 1991, one appeared only in 1992. The favorable alleles for these three QTL were contributed by Morex. There was one QTL in the ab - 500b - ab- 472 interval on chromosome 4, two adjacent QTL in the psr154 - nir and nar7 - ksua3d intervals on chromosome 6, three QTL in the rrn2 - Itpl, cdo504 - wg908 and abg496 - abc482 intervals, respectively. Two QTL with the largest effects were in the abg14 - adh8 interval on chromosome 2 and in the rrn2 - Itpl interval on chromosome 7. The favorable alleles of these QTL were contributed by Morex.
Wort protein: Nine QTL showed consistency between the two years. They were located in the amy2 - ubil interval on chromosome 1, abg14 - abc162 interval on chromosome 2, abg396 - abg703a and abg453 - cdo I 13b intervals on chromosome 3, tubal - bcd402b interval on chromosome 4., abg464 - ipgd2 interval on chromosome 5, and abg705 - abr336, rrn2 - bg123b and ale - abc302 intervals on chromosome 7. Morex was the source of all positive alleles for wort protein.
Malt beta-glucan: The two QTL with the largest effects on malt beta-glucan content were located in the abc I 54a - abg22a and abg I I - abc455 intervals on chromosome 1. The QTL on chromosomes 4, 5, and 7 showed consistency over years. Three QTL appeared in the his3c - abg14 interval on chromosome 2, abc307b - cdol 13b interval on chromosome 3 and ksudl7 - abg474 interval on chromosome 6, respectively, in 1991, but didn't show in 1992. Steptoe contributed all negative (higher percentage) alleles for beta-glucan content except for the one in the pcrI - gln2 interval on chromosome 2 which was attributed to Morex.
Diastaticpower: The QTL affecting diastatic power showed much consistency from year to year on all chromosomes except chromosome 3 where a QTL in the abg4 - inpub interval only appeared in 1992. The five largest effect QTL were resolved within the abcl56d - abg22a and abc455 - amy2 intervals on chromosome 1, ksuh I I - bmy I and cdo669 - abg3l3b intervals on chromosome 4, and aga6 - hor2 interval on chromosome 5. Morex contributed all favorable alleles except for a QTL in the ksuh I I - bmy I interval.
Alpha-amylase: Significant QTL effects were found for alpha-amylase on chromosomes 1, 2, 4, 5, and 7. The QTL with the largest effects were located in the brz - abg22a and abg701 - amy2 interval on chromosome 1, and in the bc(1402b - abg3l3b interval on chromosome 4. The Wald peaks which indicated possible location of QTL shifted from year to year, but overall support intervals were very coincident. Morex contributed all positive alleles for alpha-amylase.
Malt extract: Nine QTL were consistent frorn year to year. They are: in the abg1 I - amy2 interval on chromosome 1, in the abg2 -rbcs and abg58 - abg3l3a intervals on chromosome 2, in the wg464 - abg484 and bcd402b - cdo669 intervals on chromosome 4, in the aba4 - cdo99, glbl - abg464 and abg702 - aba2 intervals on chromosome 5, and in the abg496 - abg463 interval on chromosome 7. Some QTL only appeared in a single year. Morex contributed most positive alleles for malt extract. The positive alleles of three minor QTL, which only appear in 1991, in the dor4a - ab-703a interval on chromosome 3, abg378 - narl interval on chromosome 6, and abc483 - abg 705 interval on chromosome 7, were contributed by Steptoe.
Overlapping QTL
Chromosome 1: There were overlapping QTL for alpha-amylase, beta-glucan, diastatic power and malt extract in the Brz - abg22a and abg701 - amy2 intervals.
Chromosome 2: There were overlapping QTL for diastatic power, kernel weight, malt extract and kernel plumpness in the pox - rbcs interval, and overlapping QTL for alpha-amylase, diastatic power, kernel weight, kernel plumpness, grain protein and wort protein in the ksuF15 - abc162 interval.
Chromosome 3: There were overlapping QTL for kernel weight and kernel plumpness in the abg471 - abg396 interval, and for kernel weight, kernel plumpness and wort protein in the abg396 - psrl56 interval.
Chromosome 4: Overlapping QTL for alpha-amylase, beta-glucan, diastatic power and malt extract was located in the bcd402b - abg3l3b interval. In the wg464 - abg3 interval, there were overlapping QTL for alpha-amylase and malt extract. In the abg500b - abg472 interval, there were overlapping QTL for kernel plumpness and grain protein. QTL for kernel weight and wort protein overlapped in the abg3 - bcd402b interval.
Chromosome 5: There were overlapping QTL for alpha-amylase, beta-glucan and diastatic power in the his3b - abg702 interval, and for alpha- amylase, beta-glucan, and malt extract in the abg702 - aba2 interval.
Chromosome 6: There was only overlapping QTL for diastatic power and kernel weight in the psr106 - cxp3 interval. Three distinct QTL which controlled diastatic power, kernel weight and grain protein, were located in adjacent intervals.
Chromosome 7: There were overlapping QTL for alpha-amylase, kernel weight, kernel plumpness and wort protein in the abc706 - abc302 interval, and for kernel plumpness, grain protein and wort protein in the rrn2 - bgl23b interval.
Discussion
Number of QTL
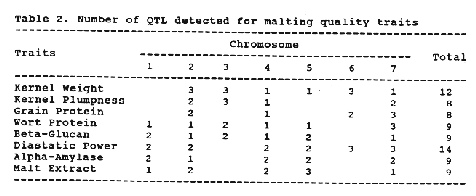
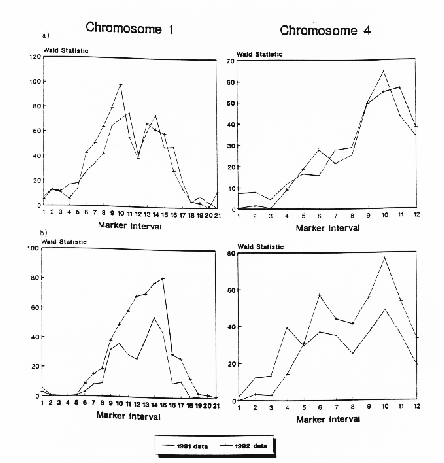
The number of QTL detected for each trait are presented in Table 2. Because a Wald peak doesn't necessarily mean presence and location of a QTL, a QTL was declared to be present when the Wald peak was detected in both years and was distinct. Wald peaks between years occasionally shifted one or two marker intervals. This phenomenon may be caused by environmental effect and statistical error.
Overlapping QTL
Overlapping QTL for different traits may be explained by trait correlation and relationship. For example, there are overlapping QTL for alpha-amylase and malt extract on chromosome I and 4 (Table 1, Figure 1). Malt extract, a measure of soluble material obtained upon mashing malt into wort, reflects the potential of malt to provide non-fermentable dextrins, fermentable sugars and nitrogenous compounds. Alpha-amylase is involved in the degradation of starch into fermentable sugars which results in the development of malt extract. Therefore, there is a significant correlation between malt extract and alpha-amylase (Hockett and White 1981; U11rich et al, 1981). A possibility is that the overlapping QTL for alpha-amylase and malt extract on chromosomes I and 4 are due to pleiotropy. There are overlapping QTL for alpha-amylase, beta-glucan, diastatic power and malt extract. Diastatic power is a measure of total amylolytic enzyme activity, including alpha-amylase. Beta--ILIcan is the major component of endosperm cell walls, if its concentration is high, it will reduce kernel modification and hydrolysis of starch, thus reducing malt extract percentage. Therefore, the overlapping QTL may be just one gene. A single gene may control several traits which are biochemically or physiologically related to one another.
References
Chen, F., and P.M. Hayes. 1989. A comparison of Hordeum bulbosum mediated haploid production efficiency in barley using in vitro floret and tiller culture. Theor. Appl. Genet. 77:701-704.
Hayes, P.M., B.H. Liu, S.J. Knapp, F. Chen, B. Jones, T. Blake, J. Franckowiak, D. Rasmusson, M. Sorrells, S.E. Ullrich, D. Wesenberg, and A.Kleinhofs. 1993. Quantitative trait locus effects and environmental interaction in a sample of North American barley germplasm. Theor. Appl. Genet. 87:392-401.
Hockett, E.A. and L.M. White. 1981. Simultaneous breeding for feed and malting quality, In: Barley Genetics IV. Proceedings of the Fourth International Barley Genetics Symposium. Edinburgh, Scotland. pp 234-241.
Kleinhofs, A., A. Kilian, M.A. Saghai Maroof, R.M. Biyashev, P. Hayes, F.Q. Chen, N. Lapitan, A. Fenwick, T.K. Blake, V. Kanazin, E. Ananiev, L. Dahleen, D. Kudrna, J. Bollinger, ST Knapp, B. Liu, M. Sorrells, M. Heun, J.D. Franckowiak, D. Hoffman, R. Skadsen, and BT Steffenson. 1993. A molecular, isozyme and morphological map of the barley (Hordeum vulgare) genome. Theor. Appl. Genet. 86:705-712.
Liu, B.H. and ST Knapp. 1990. GMENDEL: A program for Mendelian segregation and linkage analysis of individual or multiple progeny populations using log-likelihood ratios. J. Hered. 81:407.
Ullrich, S.E., C.N. Coon, and J.M. Sever. 1981. Relationships of nutritional and malting quality traits of barley. In: Barley Genetics IV. Proceedings of the Fourth International Barley Genetics Symposium. Edinburgh, Scotland. pp 225-233.
Ullrich, S.E., P.M. Hayes, W.E. Dyer, T.K. Blake, and J.A. Clancy. 1993. Quantitative trait locus analysis of seed dormancy in "Steptoe" barley. pl.36-145. In M.K. WalkerSimmons and V.L. Ried (eds). Preharvest Sprouting in Cereals 1992. Amer. Assoc. of Cereal Chemists, St. Paul, MN, USA.
Mappers included: A. Kleinhofs, A. Kilian, M.A. Saghai Maroof, R.M. Biyashev, P Hayes, F.Q. Chen, N. Lapitan,, A. Fenwick, T.K. Blake, V. Kanazin, E. Ananiev, Dahleen, D. Kudrna,, J. Bollinger, S.J. Knapp, B. Liu, M. Sorrells, M. Heun, J.D. Franckowiak, D. Hoffman, R. Skadsen, B.J. Steffenson.
QTL data collected and analyzed by: P.M. Hayes, B.H. Liu, S.J. Knapp, F. Chen, B. Jones, T. Blake, J. Franckowiak, D. Rasmusson, M. Sorrells, S.E. Ullrich, D. Wesenberg, A.Kleinhofs, F. Han