Barley Genetics Newsletter (2005) 35:9-22
![]()
Genetic diversity in barley from west China
based on RAPD and ISSR analysis
Yong-Cui Hou, Ze-Hong Yan, Yu-Ming Wei, You-Liang Zheng*
Triticeae Research Institute, Sichuan Agricultural University, Dujiangyan, 611830, China
*Corresponding author, E-mail: ylzheng@sicau.edu.cn
Abstract
Two types of molecular markers, random amplified polymorphic DNA (RAPD) and inter-simple sequence repeat (ISSR), were assayed to determine the genetic diversity of 46 barley accessions, including 27 landraces of H. vulgare ssp vulgare (HV), 6 accessions of H. vulgare ssp. spontaneum (HS) and 13 accessions of H. vulgare ssp. agriocrithon (HA), from west China. A high level of polymorphism was found with both RAPD and ISSR markers, and the mean polymorphism information content (PIC) values were 0.574 and 0.631 for RAPD and ISSR markers, respectively. In RAPD analyses, 84 out of 109 bands (77.06%) were polymorphic. The number of alleles ranged from 2 to 8 per primer, with an average of 4.19 per primer. The RAPD-based genetic similarity (RAPD-GS) ranged from 0.753 to 0.980, with the mean of 0.864. In ISSR analyses, a total of 107 alleles were detected, among which 105 alleles (98.13%) were polymorphic. The number of alleles per primer ranged from 2 to 10 with an average of 5.94 alleles per ISSR primer. The ISSR-derived genetic similarity (ISSR-GS) ranged from 0.212 to 0.931, with the mean of 0.674. ISSR was better than RAPD to detect genetic diversity among the barley accessions. A poor correlation (r = 0.113) was found between both sets of genetic similarity data, suggesting that both sets of markers revealed unrelated estimates of genetic relationships. Cluster analyses indicated that all 46 barley accessions could be distinguished by both RAPD and ISSR markers.
Key words: barley, RAPD markers, ISSR markers, genetic diversity, west China
Introduction
Barley, Hordeum vulgare L., is one of the principal cereal crops in the world and is cultivated in all temperate areas (von Bothmer et al. 1995). Wild barleys, H. vulgare ssp. spontaneum and H. vulgare ssp agriocrithon, are the primary gene pool of cultivated barley (H. vulgare ssp. vulgare). The total number of barley accessions in the Genbanks, including redundant materials, is estimated to be about 280,000 (Plucknett et al. 1987). China is known to be a genetic diversity center of barley and rich in both landrace and wild relatives of barley (Yang et al., 1987). The wild relatives of barley have been considered to be a large reservoir of genetic diversity. It is known that wild barley populations possess high genetic variation in several useful characters, including earliness, biomass and yield, protein content and a high proportion of resistant genotypes against powdery mildew and leaf rust (Nevo 1992). Due to its compatibility and full interfertility with cultivated barley, these wild species have been used as a source of important genes for cultivar development via interspecific crosses (Dávila et al. 1999a). Modern plant breeding and agriculture system have narrowed the genetic base of cultivated barley (Nevo et al. 1986). Therefore, the modern varieties are more genetically homogeneous and more exposed to pathogens and adverse environmental conditions (Asins and Carbonell 1989). This has promoted the search for new sources of variation that might be of use in plant breeding programs, and many national and international organizations have stressed the need for the collection, conservation and use of wild-species relatives of cultivated species and the endemic varieties (Brown et al. 1990). Assessment of the extent of genetic variability within barley, including the wild relatives, is fundamental for barley breeding and the conservation of genetic resources, and is particularly useful as a general guide in the choice of parents for breeding hybrids.
Molecular markers have been proved to be valuable tools in the characterization and evaluation of genetic diversity within and between species and populations. It has been shown that different markers might reveal different classes of variation (Powell et al. 1996; Russell et al. 1997). It is correlated with the genome fraction surveyed by each kind of marker, their distribution throughout the genome and the extent of the DNA target which is analyzed by each specific assay (Dávila et al. 1999b). The advent of the polymerase chain reaction (PCR) favored the development of different molecular techniques such as random amplified of polymorphic DNA (RAPD), simple sequence repeats (SSR or microsatellite), sequence tagged sites (STS), random amplified microsatellite polymorphism (RAMP) and inter-simple sequence repeat polymorphic DNA (ISSR), and so on (Saiki et al. 1988; Welsh and McCleland 1990; Williams et al. 1990; Akkaya et al. 1992; Tragoonrung et al. 1992; Zietkiewicz et al. 1994; Wu et al. 1994; Nagaoka and Ogihara 1997). These molecular markers had been used in barley for detecting genetic diversity, genotype identification, genetic mapping (Sánchez de la Hoz et al. 1996; Matus and Hayes 2002; Dávila et al. 1999a, 1999b; Dávila et al. 1998; Tragoonrung et al. 1992; Tanyolac 2003; Fernández et al. 2002; Struss and Plieske 1998). Of these techniques, RAPD has several advantages, such as simplicity of use, low cost, and the use of small amount of plant material, etc. RAPDs were proved to be useful as genetic markers in the case of self-pollinating species with a relatively low level of intraspecific polymorphism, such as hexaploid wheat (Devos and Gale 1992; Joshi and Nguyen 1993) and cultivated barley (Barua et al. 1993; Chalmers et al. 1993; Tinker et al. 1993). ISSR markers, which involve PCR amplifications of DNA using a primer composed of a microsatellite sequence anchored at 3’ or 5’ end by 2-4 arbitrary, could be used to assess genetic diversity (Qian et al. 2001). ISSRs have been used for cultivar identification in maize (Kantety et al. 1995; Pejic et al 1998), potatoes (Prevost and Wilkinson 1999), trifoliate orange (Fang et al. 1997), wheat (Nagaoka and Ogihara 1997), bean (Métais et al. 2000), Diplotaxis (Martín and Sánchez-Yélamo 2000) and barley (Fernández et al. 2002; Tanyolac 2003).
To date, knowledge regarding the amount of genetic variation and genetic relationship at molecular marker in Chinese barley germplasm is available using RAPD (Shi et al. 2004; Chen et al. 2000a, 2000b; Hong et al. 2001) and SSR (Feng et al. 2003) markers. The objectives of this study are to (1) reveal the ISSR-based genetic diversity in a barley germplasm from western China, (2) compare RAPD and ISSR diversity in the studied materials, and (3) assess the genetic diversity within the selected accessions of the barley landraces as compared to that in its wild relatives by using RAPD and ISSR molecular markers.
Materials and methods
Plant material and DNA extraction. A total of 46 barley accessions from 44 locations of west China were used in this study (Table 1). There were 27 landraces of H. vulgare ssp vulgare (HV), 6 wild relative forms of H. vulgare ssp. spontaneum (HS) and 13 wild relative forms of H. vulgare ssp. agriocrithon (HA). Genomic DNA was extracted from a bulk sampling of a minimum of ten individuals for each accession according to Sharp et al. (1988).
RAPD and ISSR analysis. A total of twenty-six 10-mer oligonucleotides with arbitrary sequence from Operon (kits A, B, H and R) were used in RAPD analysis (Table 2) and 18 primers based on dinucleotide, tetranucleotide or pentanucleotide repeats were used in ISSR analysis (Table 3). The PCR reaction mixture consisted of 20-50ng genomic DNA, 1×PCR buffer, 2.0 mmol/L MgCl2, 100 µmol/L of each dNTP, 0.1 µmol/L primer and 1U Taq polymerase in a 25μL volume. The amplification protocol was 94 ºC for 4 min to pre-denature, followed by 45 cycles of 94 ºC for 1 min, 36 ºC (for RAPD analysis) or 50 ºC (for ISSR analysis) for 1 min and 72 ºC for 1 min, with a final extension at 72 ºC for 10 min. Amplification products were fractionated on 1% (for RAPD analysis) or 2% (for ISSR analysis) agarose gel.
Data analysis. RAPD and ISSR data were scored for presence (1), absence (0) or as a missing observation (9), and each band was regarded as a locus. Two matrices, one for each marker, were generated. The genetic similarities (GS) were calculated according to Nei and Li (1979): GS = 2Nij/(Ni+Nj), where Nij is the number of bands present in both genotypes i and j, Ni is the number of bands present in genotypes i, and Nj is the number of bands present in genotype j. Based on the similarity matrix, a dendrogram showing the genetic relationships between genotypes, was constructed using the unweighted pairgroup method with arithmetic average (UPGMA) (Sneath and Sokal, 1973) though the software NTSYS-pc version1.80 (Rohlf, 1993). Polymorphic information content (PIC) values were calculated for each RAPD and ISSR primer according to the formula: PIC = 1-Σ(Pij)2, where Pij is the frequency of the ith pattern revealed by the jth primer summed across all patterns revealed by the primers (Botstein et al. 1980). The similarity between matrices based on different marker system (RAPD and ISSR) were calculated using the standardized Mantel coefficient (Mantel 1967). The significance level for the correlation coefficient was calculated following Sokal and Rohlf (1995).
Results
In RAPD analysis, a total of 109 bands were detected, among which 84 bands (77.06%) were polymorphic with the mean of 3.23 per primer (Table 2). For each primer, the number of bands ranged from 2 to 8, with an average of 4.19. The average polymorphic information content (PIC) was 0.574, ranging from 0.156 to 0.894. The lowest and the highest PIC values were recorded for primer OPH-13 and OPH-12, respectively.
In ISSR analysis, a total of 107 bands were observed, with 5.94 bands per primer (Table 3). One hundred five out of 107 bands (98.13%) were polymorphic, among which 2 to 10 polymorphic bands were detected by each primer. The average PIC was 0.636, and the lowest and highest PIC values were 0.351 (ISSR16) and 0.874 (ISSR18), respectively. Four ISSR primers (i.e. ISSR18, ISSR7, ISSR6 and ISSR8) had the higher PIC values.
All the 109 bands, generated from 26 RAPD primers, were subjected to calculate the genetic similarity index (RAPD-GS) among the 46 accessions (Table 4.). The RAPD-GS value ranged from 0.735 to 0.980, with the mean of 0.864. The highest genetic similarity was found between HV accession B65 (from Xizang) and HV accession B21 (from Sichuan), while the lowest genetic similarity was observed between HV accession B76 (from Sichuan) and HA accession ZYM0531 (from Xizang). It was found that the genetic similarities within the HV and HA groups were equal to that within HS group.
The ISSR-derived data were subjected to calculate the genetic similarity (ISSR-GS) (Table 4). The genetic similarity coefficient varied between 0.212 and 0.931, with the average of 0.674. The minimum GS value derived between HV accession B22 (from Xizang) and HA accession ZYM0834 (from Xizang), while the maximum GS value derived between HV accession B22 (from Xizang) and HV accession B40 (from Sichuan). The average genetic similarity within HS accessions (0.645), HA accessions (0.623) and all accessions (0.674) exhibited equivalent to each other, and the average genetic similarity within HV accessions (0.716) was higher than that of all accessions. In contrast to RAPD-GS, the ISSR-GS within HS accessions (0.645) and HA accessions (0.623) were significant lower than that within HV (0.716). It indicated that the wild barley groups were more diverse than the landraces group. The average genetic similarity values based on ISSR markers were lower than that of RAPD markers both within landraces and wild barley accessions, as well as among the all accessions. These results suggested that higher genetic diversity could be detected by ISSR markers than that of RAPD markers among the 46 barley accessions from west China.
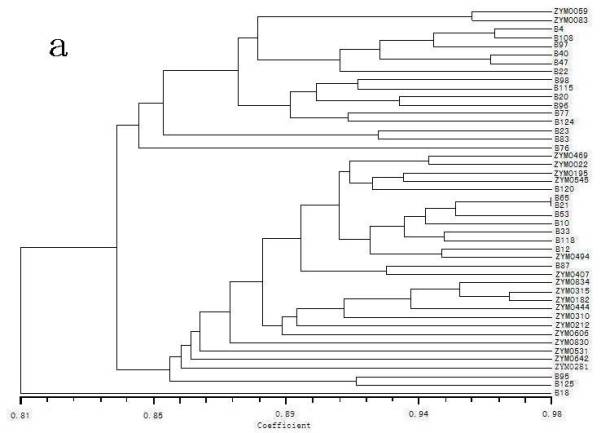
The relationships within and between groups were estimated by a UPGMA cluster analysis of GS matrices (Fig 1.). It indicated that all 46 barley accessions could be distinguished by both RAPD and ISSR markers. Fig. 1a was the dendrogram based on RAPD data. One HV accession (B18) with six rowed and hulled, which collected from Hongyuan, Sichuan, was less related with other genotypes, and divergent from the others. Two subgroups were evident for the remaining 45 genotypes. The first subgroup contained 17 accessions, including 2 HS accessions (ZYM0059 and ZYM0083) and 15 HV accessions. The second subgroup consisted of 28 accessions, including 4 HS accession, 13 HA accessions and 11 HV accessions. The genotypes were more closely related with each other within the second subgroup, whereas more diverse within the first subgroup.
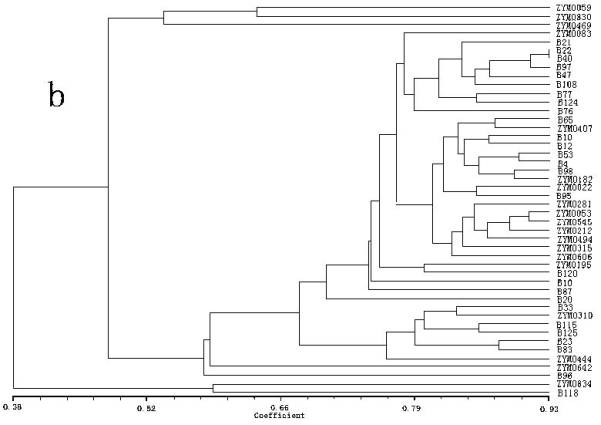
Fig. 1b was the dendrogram generated from ISSR data. One HA accession (ZYM0834) and One HV accession ( B118), which were collected from Xizang, were less related with other genotypes, and divergent from the others. Two subgroups were evident for the remaining 44 accessions, with the first subgroup only including one HS accession (ZYM0059) and two HA accessions (ZYM0830 and ZYM0469). The second subgroup including 41 genotypes consisted of 5 HS accessions, 10 HA accessions and 26 HV accessions. The genotypes were more closely related with each other within the second subgroup, while more diverse within the first subgroup.
The correlation coefficient for the elements of the RAPD-GS and ISSR-GS matrices was calculated using the Mantel test (Mantel 1967). There was no significant correlation (r = 0.113) between the RAPD-GS and ISSR-GS matrices, indicating that both sets of markers revealed the unrelated estimates of genetic relationships.
Discussion
In this study, genomic DNA was extracted from a bulk sampling for each accession. The advantages and inconvenient of the bulk analysis have been discussed by Michelmore et al. (1991) and Loarce et al. (1996). Bulk analyses are economic and rapid, and it is possible to estimate the genetic variability between accessions, whereas it is not possible to obtain information about the genetic variability within the accessions (Fernández et al. 2002). The number of individual plants bulked for the accessions is an important experimental factor whether the bulked analysis revealed the genetic relationship between the accessions. Yang and Quiros (1993) found that the bulked samples with 10, 20, 30, 40 and 50 individuals had the same banding pattern. Bustos et al. (1998) also found that bulks of 10 to 20 individuals resulted in the same RAPD profiles. In this study, we used a minimum of ten individuals for representing the each barley accession. The results indicated that the percentage of ISSR polymorphic bands (98.13%) was higher than that of RAPD (77.06%). The mean number of amplification RAPD bands (4.19) was more than that of ISSR (5.94). Moreover, the total number of polymorphic bands (105) detected by 18 ISSR primers was much higher than that of the 26 RAPD primers (84). And the mean polymorphism information content (PIC) (0.631) in ISSR analysis also was higher than that in RAPD analysis (0.574). The bulk analysis of RAPD and ISSR markers could successfully be used to investigate the genetic diversity of the barley landraces and the wild forms from west China. However, the results in this study suggested that the ISSR markers were superior to RAPD markers in the capacity of revealing more informative bands in a single amplification. The similar results were observed by Fernández et al. (2002) and Tanyolac (2003).
Due to its worldwide distribution, the valuation of the genetic diversity among barley germplasm from different countries has been performed (Tanyolac 2003; Liu et al. 2002; Fernández et al. 2002; Matus et al. 2002; Dávila et al. 1999a, 1999b; Dávila et al. 1998; Konishi 2001; Bustos et al. 1998; Bjornstad et al. 1997; Chen et al. 2000b; Feng et al. 2003). Bernard et al. (1997) analyzed the genetic diversity in 88 genotypes from 20 populations of wild barley from Israel, Turkey and Iran by RAPD markers. When the total genetic diversity was estimated, 75% of the variation detected was partitioned within the 88 genotypes and 25% among the populations. When variation between countries was assessed, no substantial differences were found, because most of the variation detected (97%) was partitioned within the 20 populations and the remainder among the countries. Russell et al. (1997) found that the average genetic diversity based on RAPD analyses of eighteen accessions from Netherlands, France, Great Britain, Germany and Italy was 0.521. Bahattin (2003) assayed 15 wild barley populations from west Turkey by using RAPD and ISSR markers. The results revealed that the average genetic similarity was 0.27 and the genetic variation was higher than that found by Nevo et al. (1979) and Nevo et al. (1986) both using isozyme markers. In the present study, the average genetic similarities of barley accessions from western China based on RAPD and ISSR markers were 0.864 and 0.674, respectively. The similarities detected with RAPDs are greater than the similarities observed with ISSRs. Fernández et al. (2002) also found similar results. The genetic variation found in this study was equivalent with that found by Chen et al. (2000a) (0.81), Shi et al. (2004) (0.631) and Chen et al. (2000b) (0.746) both using RAPD markers to analyze the genetic variation of different barley populations from China. But the variation was relatively lower than that from other country (Russell et al. 1997; Bahattin 2003).
In this study, it was obvious that the dendrogram based on RAPD markers was not in accord with the dendrogram based on ISSR markers. The dendrogram generated by the RAPD matrix agrees better with the groups of the genotypes than the dendrogram generated by the ISSR results (Fig. 1a). Most of the genotypes within the wild barley and the landrace were closely related. However, the dendrogram generated by the ISSR matrix agrees better with the geographic origins of the genotypes than the dendrogram generated by the RAPD results (Fig. 1b). For example, three landraces (i.e. B65, B118 and B120) originating from Xizang, were closely clustered with the wild forms originating from Xizang. Fernández et al. (2002) found the dendrogram generated by the ISSR matrix agrees better with the genealogy and the known pedigree of the barley cultivars than the dendrogram generated by the RAPD results. Wu et al. (2004) found that the data based on RAPD-GS were more correlated with the geographic distribution of the genus Houttuynia Thunb, while the data based on ISSRs were closely related with their number of chromosomes. It could be partially explained by the different number of informative PCR products (84 for RAPDs and 105 for ISSRs). They reinforced again the importance of the number of loci and their coverage of the overall genome and obtained reliable estimates of genetic relationship among the studied materials (Fernández et al. 2002). Similar results had been observed by Loarce et al. (1996). On the other hand, the relationship observed using molecular markers may provide information on the history and biology of cultivars, but it does not necessarily reflect what may be observed with respect to agronomic traits (Métais et al. 2000). The selection process leads to an accumulation of best alleles for the traits under selection. RAPDs and ISSRs are dispersed throughout the genome and their association with agronomic traits is influenced by the breeder only in the region under selection pressure. The other loci are subjected to random genetic drift (Fernández et al. 2002). Another explanation could be the putatively similar bands originating for RAPDs in different bulked samples were not necessarily homologous although they shared the same size in base pairs (Karp et al. 1997). This situation might lead to wrong results when calculating genetic relationships (Fernández et al. 2002).
Acknowledgments
The wild barley accessions were kindly supplied by Prof. D. Q. Ma (Institute of Crop Germplasm Resources, CAAS). This work was supported by the Hi-Tech Research and Development (863) Program of China (2003AA207100) and the Foundation for the Author of National Excellent Doctoral Dissertation of PR China (200357). Y.-L. Zheng was supported by Program for Changjiang Scholars and Innovative Research Team in University (PCSIRT), China.
References
Asins MJ, EA Carbonell. 1989. Distribution of genetic variability in a durum wheat world collection. Theor Appl Genet., 77: 287-294
Akkaya MS, AA Bhagwast and PB Cregan. 1992. Length polymorphisms of simple sequence repeat DNA in soybean. Genetics., 132: 1131-1139
Bahattin T. 2003. Inter-simple sequence repeat (ISSR) and RAPD variation among wild barley (Hordeum vulgare subsp. spontaneum) populations from west Turkey. Genetic Resources and Crop Evolution., 50: 611-614
Barua UM, KJ Chalmers, CA Hackett, WTB Thomas, W Powell, R Waugh. 1993. identification of RAPD markers linked to a phynchosporium secalis resistance locus in barley using nearisogenic lines and bulked segregant analysis. Heredity., 71: 177-184
Bernard RB, E Nevo, AJ Douglas and A Beiles. 1997. Genetic diversity in wild barley (Hordeum spontaneum C. Koch) in the near east: a molecular analysis using random amplified polymorphic DNA (RAPD) markers. Genetic Resources and Crop Evolution., 44: 147-157
Bustos AD, C Casanova, C Soler, N Jouve. 1998. RAPD variation in wild populations of four species of the genus Hordeum (Poaceae). Theor Appl Genet., 96: 101-111
Brown ADH, JJ Burdon, JP Grace. 1990. Genetic structure of Glycine canescens. A perennial relative of soybean. Theor Appl Genet., 79: 729-736
Bjornstad A, A Demisse, A Killian, A Kleinhofs. 1997. The distinctness and diversity of Ethiopian barley. Theor Appl Genet., 94: 514-521
Botstein D, RL White, M Skolnick, RW Davis. 1980. Construction of a genetic linkage map in man using restriction fragment length polymorphisms. Am. J. Hum. Genet.,32: 314-331
Chen XP, L Yan, Y Ding, WX Gao. 2000a. Analysis of germplasms of Hubei barley by randomly amplified polymorphic DNA (RAPD). J. Wuhan Univ. (Natural Science Edition)., 46(2): 249-252
Chen XP, L Yan, Y Ding. 2000b. RAPD analysis and the probable evolutionary route of wild relatives of barley from China. Acta Botanica Sinica., 42(2): 179-183
Chalmers KJ, UM Barua, CA Hackett, WTB Thomas, R Waugh, W Powell. 1993. Identification of RAPD markers linked to genetic factors controlling the milling energy requirement of barley. Theor Appl Genet., 87: 314-320
Dávila JA, Y Loarce, L Ramsay, R Waugh, E Ferrer. 1999a. Comparison of RAMP and SSR markers for the study of wild barley genetic diversity. Hereditas., 131: 5-13
Dávila JA, Y Loarce, E Ferrer. 1999b. Molecular characterization and genetic mapping of random amplified microsatellite polymorphism in barley. Theor Appl Genet., 98: 265-273
Dávila JA, MP Sánchez de la Hoz, Y Loarce, E Ferrer. 1998. The use of random amplified microsatellite polymorphic DNA and coefficients of parentage to determine genetic relationship in barley. Genome., 41: 477-486
Devos KM, MD Gale. 1992. The use of random amplified polymorphic DNA markers in wheat. Theor Appl Genet., 84: 567-572
Fang DQ, ML Roose, RR Krueger, CT Federicé. 1997. Fingerprinting trifoliate orange germplasm accessions with isozymes, RFLP and inter-simple sequence repeat markers. Theor Appl Genet., 95: 211-219
Feng ZY, YZ Zhang, LL Zhang, HQ Ling. 2003. Genetic diversity and geographical differentiation of Hordeum vulgare ssp. spontaneum in Tibet using microsatellite markers. High Technology Letters., 10: 46-53
Fernández ME, AM Figueiras, C Benito. 2002. The use of ISSR and RAPD markers for detecting DNA polymorphism, genotype identification and genetic diversity among barley cultivars with known origin. Theor Appl Genet., 104: 845-851
Hong QB, L Hou, XY Luo, DM Li, YH Xiao, Y Fei, KJ Yang, C Jia. 2001. Using RAPD for evaluating genetic background among naked barley varieties in Sichuan northwestern region. Sci Agric Sin., 34(2): 133-138
Joshi Cp, HT Nguyen. 1993. RAPD (Random amplified polymorphic DNA) analysis based on intervarietal genetic relationships among hexaploid wheats. Plant Sci., 93: 95-103
Karp A, K Edwards, M Bruford. 1997. Newer molecular technologies for biodiversity evaluation: opportunities and challenges. Nature Biotechnol., 15: 625-628
Kantety RV, XP Zeng, JL Bennetzen, BE Zehr. 1995. Assessment of genetic diversity in Dent and Popcom (Zea mays L.) inbred lines using inter-simple sequences repeat (ISSR) amplification. Mol Breed., 1: 365-373
Konishi T. 2001. Genetic diversity in Hordeum agriocrithon E. Åberg, six-rowed barley with brittle rachis, from Tibet. Genetic Resource and Crop Evolution., 48: 27-34
Loarce Y, R Gallego, E Ferrer. 1996. A comparative analysis of genetic relationship between rye cultivars using RFLP and RAPD markers. Euphytica., 88: 107-115
Liu F, GL Sun, B Salomon, R Von Bothmer. 2002. Characterization of genetic diversity in core collection accessions of wild barley, Hordeum vulgare ssp. spontaneum. Hereditas., 136: 67-73
Martín JP, MD Sánchez-Yélamo. 2000. Genetic relationships among species of the genus Diplotaxis (Brassicaceae) using inter-simple sequence repeat markers. Theor Appl Genet., 101: 1234-1241
Matus IA and PM Hayes. 2002. Genetic diversity in three groups of barley germplasm assessed by simple sequence repeats. Genome., 45: 1095-1106
Mantel M. 1967. The detection of disease clustering and a generalized regression approach. Cancer. Res., 27: 209-220
Métais I, C Aubry, B Hamon, R Jalouzot. 2000. Description and analysis of genetic diversity between commercial bean lines (Phaseolus vulgaris L.). Theor Appl Genet., 101: 1207-1214
Michelmore RW, I Paran, RV Kesseli. 1991. Identification of markers linked to disease resistance genes by bulk segregant analysis: a rapid method to detect markers in specific genomic regions using segregating populations. Proc Natl Acad Sci., USA. 88: 9828-9832
Nevo E, D Zohary, AHD Brown and M Haber. 1979. Genetic diversity and environmental associations of wild barley, Hordeum spontaneum, in Israel. Evolution., 33: 815-833
Nevo E, D Zohary, A Beiles, D Kaplan and N Storch. 1986. Genetic diversity and environmental associations of wild barley, Hordeum spontaneum, in Turkey. Genetica., 68: 203-213
Nevo E. 1992. Origin, evolution, population genetic and resources for breeding of wild barley. Hordeum spontaneum. In the fertile Crescent. In: Barley: Genetics. Biochemistry. Molecular Biology and Biotechnology (ed PR Shewry) CAB international. Wallingford. 19-143
Nagaoka T and Y Ogihara. 1997. Applicability of inter-simple sequence repeat polymorphism in wheat for use as DNA markers in comparison to RFLP and RAPD markers. Theor Appl Genet., 94: 597-602
Nei M, W Li. 1979. Mathematical model for studying genetic variation in terms of restriction endonucleases. Proc. Natl. Acad. USA., 76: 5269-5273
Plucknett DL, NJH Smith, JT Williams, AN Murthi. 1987. Genebanks and the world’s food. Princeton University Press, Princeton New Jersey, USA.
Pejic I, P Ajmone-Marsan, M Morgante, V Kozumplick, P Castiglioni, G Taramino, M Motto. 1998. Comparative analysis of genetic similarity among maize inbred lines detected by RFLPs, RAPDs, SSRs and AFLPs. Theor Appl Genet., 97: 1248-1255
Prevost A, MJ Wikinson. 1999. A new system of comparing PCR primers applied to ISSR fingerprinting of potato cultivars. Theor Appl Genet., 98: 107-112
Powell W, M Morgante, C Andre. 1996. The comparision of RFLP, RAPD, AFLP and SSR(microsatellite) marker for germplasm analysis. Mol Breeding., 2: 225-238
Qian W, S Ge and DY Houng. 2001. Genetic variation within and among populations of a wild rice Oryza granulata from China detected by RAPD and ISSR markers. Thore Appl Genet., 102: 440-449
Rohlf FJ. 1993. NTSYS-pc version 1.80. Distribution by Exeter Software, Setauket, New York.
Russell JR, JD Fuller, M Macaulay, BG Hatz, A Jahoor, W Powell, R Waugh. 1997. Direct comparison of levels of genetic variation among barley accessions detected by RFLPs, AFLPs, SSRs and RAPDs. Theor Appl Genet., 95: 714-722
Sokal RR and FJ Rohlf. 1995. Biometry: The principles and practice of statistics in biological research. (3d edition). WH Freeman and Company. New York. USA.
Saiki RK, DH Gelfond, S Stoffel, SJ Scharf, R Higuchi, BT Horn, KB Mullis and HA Erlich. 1988. Primer-directed anzymatic amplification of DNA with a thermostable DNA polymerase. Science., 239: 487-491
Sánchez de la Hoz MP, JA Dávila, Y Loarce and E Ferrer. 1996. Simple sequence repeat primers used in polymerase chain reaction amplifications to study genetic diversity in barley. Genome., 39: 112-117
Struss D and J Plieske. 1998. The use of microsatellite markers for detection of genetic diversity in barley populations. Theor Appl Genet., 97: 308-315
Shi YT, HW Bian, N Han, JW Pan, WX Tong, MY Zhu. 2004. Genetic variation analysis by RAPD of some barley cultivars in China. Acta Agronomica Sinica., 30(3): 258-265
Sharp PJ, M Kresis, PR Shewry and MD Gale. 1988. Location of β-amylase sequences in wheat and its relatives. Theor Appl Genet., 75: 286-290
Sneath PHA and RR Sokal. 1973. Numerical Taxonomy. Freeman, San Francisco.
Tragoonrung S, V Kanazin, PM Hayes and TK Blake. 1992. Sequence-tagged-site facilitated PCR for barley genome mapping. Theor Appl Genet., 84: 1002-1008
Tanyolac B. 2003. Inter-simple sequence repeat (ISSR) and RAPD variation among wild barley (Hordeum vulgare subsp. spontaneum) populations from west Turkey. Genetic Resources and Crop Evolution., 50: 611-614
Tinker NA, MG Fortin, DE Mather. 1993. Random amplified polymorphic DNA and pedigree relationship in spring barley. Theor Appl Genet., 85: 976-984
von Bothmer R, N Jacobsen, C Baden, RB Jørgensen and I Linde-Laursen. 1995. An ecogeographical study of the genus Hordeum. International Plant Genetic Resources, Rome. P.29.
Welsh J and J McClelland. 1990. Fingerprinting genomes using PCR with arbitrary primers. Nucleic Acids Res., 18: 7213-7218
Williams JGK, AR Kubelik, KJ Livak, JA Rafalski and SV Tingey. 1990. DNA polymorphisms amplified by arbitrary primers are useful as genetic markers. Nucleic Acids Res., 18: 6531-6535
Wu KS, J R ones, L Danneberger. 1994. Detection of microsatellite polymorphisms without cloning. Nucleic Acids Res., 22: 3257-3258
Wu W,YL Zheng,L Chen,YM Wei,RW Yang and ZH Yan. 2005. Evaluation of genetic relationships in the genus Houttuynia Thunb. in China based on RAPD and ISSR markers. Biochemical Systematics and Ecology., (Accepted)
Yang JL, C Yen, BR Lu, R von Bothmer. 1987. The genus Hordeum (Gramineae) in China. Variation and distribution. Willdenowia, 16: 479-490
Yang X, C Quiros. 1993. Identification and classification of celery cultivars with RAPD markers. Theor Appl Genet., 86: 205-212
Zietkiewicz E, A Rafalski, D Labuda. 1994. Genome fingerprinting by simple sequence reprat (SSR)-anchored polymerase chain reaction amplification. Genomics.,20: 176-783