Update of barley
stripe rust resistance QTL
in the
Calicuchima-sib x Bowman mapping population
Ariel Castro, Patrick M.
Hayes, Tanya Fillichkin, and Carlos Rossi.
Barley Project, Department of Crop and Soil Sciences,
Oregon State University, Corvallis, OR 97331
Hard-copy edition pages 1 - 12.
Introduction
Barley stripe rust (caused by Puccinia striiformis f.sp. hordei)
(BSR) is an important disease of barley that has caused serious yield losses in
Europe, in the Asian subcontinent, and in the Americas. At least one million of
the approximately 3.2 million acres of barley in the western U.S. could be
considered at risk to BSR (see review by Hayes et al., 2001).
Race-specific resistance has shown lack of durability, justifying the search for durable sources of resistance. Using recurrent selection schemes ICARDA/CIMMYT developed germplasm that has remained resistant to BSR over a 15-year period, with the resistance showing quantitative inheritance in a number of studies (Hayes et al., 2001). In order to accomplish both resistance gene identification and introgression as quickly and efficiently as possible, a collaborative effort was initiated to use molecular markers for resistance QTL mapping and marker-assisted selection (reviewed by Hayes et al., 2001).
As part of this project, a F1-derived
doubled haploid population was developed from the cross between
“Calicuchima-sib” (LBIran/UNA8271//Gloria/Comé) and “Bowman”. Bowman is a
2-rowed feed variety, and “Calicuchima-sib” is a BSR resistant six-rowed line
developed by Dr. Hugo Vivar at ICARDA/CIMMYT. Chen et
al. (1994)
mapped two QTL for BSR adult plant resistance on chromosomes 4(4H) and 7(5H) in
this population, with Calicuchima-sib contributing the resistance alleles. Hayes et al. (1996)
mapped seedling resistance QTL alleles in Calicuchima-sib to chromosomes 4(4H)
and 6(6H). The chromosome 4(4H) QTL mapped to the same region as the adult
plant resistance QTL, and Calicuchima showed a resistant reaction when
inoculated with an isolate of P. striiformis f. sp. hordei BSR corresponding to race 24.
As stated by Hayes et al. (1996), the
QTL data on chromosome 4(4H) were “complex” and did not lend themselves to
straightforward interpretation. Chen et al. mapped an adult plant resistance
QTL on this chromosome, in a 40cM interval (ABG397-Bmy1), and this QTL
showed a small effect. Hayes et al. (1996), using
new QTL analysis tools, but based on the same adult plant data also detected a
QTL in the same interval. However, the QTL was significant in only one of three
environments and it showed significant QTL x E interaction. They concluded that
the interaction was due to change in magnitude of response. QTL position and
significance remained ambiguous. They also reported a seedling resistance QTL
and a heading date QTL in the same region.
In order to improve estimation of QTL location and effect, we report in this paper the inclusion of new markers in the Calicuchima-sib/Bowman map as well as the analysis of the data with new QTL software. Our reanalysis of these data was motivated by the need to better define the role of Cali-sib resistance alleles in genetic stocks that are pyramids of resistance alleles from multiple resistance donors (Castro et al., 2000).
Linkage map
A total of 69 loci have been genotyped in this population, 57 of them were integrated in a linkage map comprising 8 linkage groups. Two linkage groups correspond to chromosome 3(3H) and the rest correspond to the other six barley chromosomes (Figure 1). We added nine SSR markers in regions of particular interest for our pyramiding proyect to the previous version of this map. The SSRs added were: in chromosome 1(7H) Bmac156; in chromosome 4(4H) HVMLo3, Bmac30, Bmac310, and HvAmyB (which cosegregates with Bmy1); in chromosome 5(5H) Bmac213; in chromosome 6(6H) Bmac173; and in chromosome 7(5H) Bmag5 and Bmag337. Also scored five assayed SSR markers failed to showed polymorphism (EBmac635, EBmac788, EBmac701, Bmac96 and Bmac303). SSR were assayed as described by Liu et al. (1996) and scored using an ABI-377 gene sequencer.
Linkage analysis was performed using G-Mendel 3.0 (Halloway and Knapp, 1984). Figure 1 represents the resulting map, showing the added markers.
QTL Analysis
For the QTL analysis we used the single trait and multi-environment options implemented in MultiQTL 1.5 (http://esti.haifa.ac.il/~poptheor/MultiQtl/MultiQtl.htm), using interval mapping. We used the phenotype datasets from Hayes et al. (1996), which include seedling infection, heading date and adult plant resistance in three field environments in Mexico (Env1, Env2 and Env3). We used the multi-environment option of MultiQTL to jointly analyze the three adult plant dataset.
Each dataset was analyzed with 1000 permutations in order to establish the significance of the QTL. A bootstrap simulation (with 1000 samples) was used for the assignment of each significant QTL to a marker interval. Genome regions affecting the traits under study revealed by the QTL scans were used in performing a QTL analysis analogous to candidate gene analysis, where the genotypes of the flanking markers are used as independent variables. Recombinant genotypes were not included in the analysis. Therefore, the independent variables had two levels each, with each level corresponding to a parental genotype. The treatment design was a 2 x n factorial, where n is the number of genome regions detected. The difference between parental marker class means estimates the additive effect of the QTL flanked by the markers. Double crossovers between the QTL and marker loci downwardly bias estimates of the effects. Thus, differences between parental marker genotype means are conservative estimates of the effects of QTL residing in the n chromosomal regions.
For the seedling resistance dataset, because the response (dependent) variable was binomial (1 = resistant and 0 = susceptible) and the response probability distribution was binomial, the analysis was performed using a generalized linear model (Nelder and Wedderburn, 1972; McCullagh and Nelder, 1989) with a logit link function, g(μ) = log[μ/(1 - μ )], and binomial errors, where μ is the expected value of y = r/n (the probability of resistance to stripe rust), r is the number of resistant lines, n is the total number of lines, and r = 1, 2, ..., n.. The probability distribution and variance of y are
![]()
and [μ(1 - μ)]/n, respectively.
Statistical analyses were performed using the SAS (2001) GLM and GENMOD
procedures. Parameters and test
statistics were estimated using a Type III analysis (analogous to partial sums
of squares analyses of general linear models). The probability of seedling
resistance to stripe rust was estimated by ep/(1
+ ep), where p is the least square mean for the
individual QTL and QTL x QTL interaction.
Results and Discussion
The QTL scans obtained from MultiQTL are
presented for chromosome 1(7H) (Figure 2), 4(4H) (Figure 3), 6(6H) (Figure 4)
and 7(5H) (Figure 5). Scans for the rest of the chromosomes are not presented
because no QTL effects were detected on them. A total of 17 QTL candidates were
initially detected (two for heading date; three for seedling resistance; two
for adult plant resistance in Env1, three in Env2, and three in Env3; and four
for adult plant resistance multi-environment), comprising six regions in five
chromosomes (Table1).
Regarding the situation in chromosome
4(4H) we analyzed two alternatives: considering only one QTL in the ABG472
- Bmy1 interval, or two adjacent QTL with one in the ABG472 - ABG397
interval, and the other in the ABG397 -
Bmy1 interval. ANOVA results showed that the second alternative
is more likely.
Most of the significant QTL regions are
coincident with previous reports (Chen et al., 1994; Hayes et al., 1996), but
there were no previous reports of effects in chromosomes 1(7H) and 3(3H) in
this mapping population. The results from the candidate gene analysis (Table 2
for individual traits, Table 3 for stripe rust multi-environment analysis, and
Table 4 for seedling resistance) confirm the candidate QTL with the exception
of the seedling resistance QTL candidate initially detected in chromosome
1(7H).
Heading date
Two QTL were detected for heading date
in chromosomes 3(3H) and 4(4H). The latter, with the larger effect, was
reported by Hayes et al. (1996), but the former hadn’t been reported yet. In
both cases Calicuchima-sib contributed the later heading date alleles.
Seedling resistance
The results of the seedling resistance
analysis confirm the location of the two QTL reported by Hayes et al. (1996) on
chromosomes 4(4H) and 6 (6H). The QTL on chromosome 4(4H) was adjacent to, but
distinct from, the heading date QTL. At both resistance QTL, Calicuchima
contributed the resistant allele. What is new in this analysis is the detection
of the significant interaction between the two resistant QTL (Table 4). In
spite of the significant main effect for both QTL, the least squares estimates
of the probability of obtaining a susceptible phenotype (Figure 6) show that it
is actually necessary to have resistance alleles at both QTL in order to have
the highest (79%) probability of resistance.
Adult plant resistance
Two QTL affecting adult plant stripe
rust severity were detected in one environment (Env1) and three QTL in each one
of the other two environments (Env2 and Env3). A major QTL in chromosome 7(5H),
with Calicuchima-sib contributing the resistance allele, was common to all the
environments. In all cases, this was the largest-effect QTL (Figure 6). Chen et al. (1994) and Hayes et al. (1996) also
reported that this was the largest-effect QTL. A second QTL for adult plant
stripe rust severity in Env1 was detected in chromosome 4(4H). According to the
QTL scans, this QTL overlaps both the seedling resistance and the heading date
QTL. Calicuchima-sib contributed the resistance allele and the later heading
allele.
Table 1. Summary of QTL detected, their location, significance
level, and percentage of the total variation explained for Barley Stripe Rust
resistance and heading date explained. Multi-environment refers to the
simultaneous analysis of multi-environment data.
|
|
|
|
Heading date |
Seedling resistance |
Stripe rust
Env1 |
|||
|
|
Chrom. |
Flanking markers |
p-value |
PVE1 |
p-value |
PVE1 |
p-value |
PVE1 |
|
QTL1 |
1(7H) |
ABC455 – rPh2 |
n.s. |
|
0.050 |
8.4 |
n.s. |
|
|
QTL3 |
3(3H) |
ABG377 – ryd2 |
0.041 |
6.9 |
n.s. |
|
n.s. |
|
|
QTL4a |
4(4H) |
ABG472 – ABG397 |
n.s. |
|
<0.0001 |
25.9 |
0.020 |
11.6 |
|
QTL4b |
4(4H) |
ABG397 – Bmy1 |
<0.0001 |
23.8 |
n.s. |
|
||
|
QTL6 |
6(6H) |
ABG466 – ABG458 |
n.s. |
|
0.005 |
16.6 |
n.s. |
|
|
QTL7 |
7(7H) |
Ale – CDO57 |
n.s. |
|
n.s. |
|
<0.0001 |
44.3 |
|
Percentage of variation explained (PVE) |
|
28.2 |
|
38.2 |
|
52.7 |
||
|
|
Stripe rust
Env2 |
Stripe rust
Env3 |
Multi-environment analysis |
|||||
|
|
p-value |
PVE1 |
p-value |
PVE1 |
p-value |
PVE1 Env1 |
PVE1Env2 |
PVE1Env3 |
|
QTL1 |
<0.0001 |
13.1 |
0.008 |
10.6 |
<0.0001 |
5.0 |
14.8 |
10.8 |
|
QTL3 |
n.s. |
|
n.s. |
|
n.s. |
|
n.s. |
|
|
QTL4a |
n.s. |
|
n.s. |
|
0.008 |
7.4 |
4.2 |
6.4 |
|
QTL4b |
n.s. |
|
n.s. |
|
||||
|
QTL6 |
0.011 |
18.5 |
0.042 |
14.9 |
0.002 |
9.7 |
18.2 |
10.4 |
|
QTL7 |
<0.0001 |
67.8 |
<0.0001 |
58.5 |
<0.0001 |
49.8 |
68.9 |
56.7 |
|
PVE1 |
|
79.1 |
|
68.5 |
|
58.0 |
81.6 |
78.6 |
1 PVE: Percentage of variance explained
Two additional QTL significant in both
the Env2 and the Env3 data, were located on chromosome 1(7H) and 6 (6H). QTL
positions coincide with the seedling resistance QTL
in chromosome 6(6H), and with the QTL
detected for seedling resistance (but not confirmed in the candidate analysis)
in chromosome 1(7H). Calicuchima contributed the resistance alleles on
chromosome 6(6H) and Bowman the resistance alleles on chromosome 1(7H). Neither
of these two adult plant resistance QTL were previously reported. Their
detection can be due to the use of new software, but the ANOVA results
confirmed us that they are not
software-dependent artifacts. The four adult plant resistance QTL - on
chromosomes 1(7H), 4(4H), 6(6H) and 7(5H) – were significant in the
multi-environment analysis and accounted for 58.0, 81.6, and 78.6 PVE for Env1,
Env2 and Env3 respectively.
Table 2. Summary of the ANOVA for individual traits. Only the QTL
detected in each individual analysis were included in the model, and only
significant interactions are presented.
|
|
Heading
Date |
Stripe rust Env1 |
Stripe rust Env2 |
Stripe rust Env3 |
||||
|
|
M.S. |
Pr>F |
M.S. |
Pr>F |
M.S. |
Pr>F |
M.S. |
Pr>F |
|
QTL1 |
---- |
----- |
----- |
----- |
1281 |
0.0276 |
806 |
0.0737 |
|
QTL3 |
52.5 |
0.0176 |
----- |
----- |
------ |
------ |
----- |
------ |
|
QTL4a |
----- |
----- |
2592 |
0.0104 |
------ |
------ |
----- |
------ |
|
QTL4b |
108.5 |
0.0008 |
----- |
------ |
----- |
----- |
----- |
------ |
|
QTL6 |
----- |
----- |
----- |
----- |
1872 |
0.0083 |
1866 |
0.0073 |
|
QTL7 |
----- |
----- |
12009 |
<0.0001 |
14869 |
<0.0001 |
12259 |
<0.0001 |
|
QTL4axQTL7 |
|
|
1582 |
0.0439 |
|
|
|
|
|
QTL6xQTL7 |
|
|
|
|
|
|
955 |
0.0521 |
|
MSE |
9.0 |
|
380 |
|
253 |
|
244 |
|
|
R2 |
0.148 |
|
0.348 |
|
0.530 |
|
0.484 |
|
Table 3. ANOVA for the multi-environment analysis of adult plant
severity. Only the QTL main effects and significant QTLxQTL interactions are
presented.
|
|
df. |
SS |
M.S. |
Pr>F |
|
Environment |
2 |
12080 |
6040 |
<0.001 |
|
QTL1 |
1 |
2024 |
2024 |
0.0080 |
|
QTL4a |
1 |
1966 |
1966 |
0.0089 |
|
QTL6 |
1 |
3292 |
3292 |
0.0008 |
|
QTL7 |
1 |
29450 |
29450 |
<0.0001 |
|
QTL1xQTL4a |
1 |
1162 |
1162 |
0.0436 |
|
QTL1xQTL7 |
1 |
1312 |
1312 |
0.0322 |
|
QTL4axQTL6 |
1 |
1135 |
1135 |
0.0461 |
|
Error |
198 |
55810 |
282 |
|
|
R2 |
0.520 |
|
|
|
Table 4. Likelihood ratio test for tests of significance of the QTL main effects and interactions for seedling infection (p- values were calculated using asymptotic chi-square distributions).
|
|
df
|
χ2 statistic |
P< χ2 |
|
QTL4a |
1 |
17.33 |
<0.0001 |
|
QTL6 |
1 |
9.34 |
0.0022 |
|
QTL4a x QTL6 |
1 |
6.20 |
0.0128 |
Chromosome 4(4H) results
Our analysis contributes somewhat to
resolving the complex QTL data on chromosome 4(4H), where Hayes at al. (1996)
reported overlapping peaks for multiple traits. This overlap left questions
regarding the linkage or pleiotropy of resistance and heading date unanswered.
As shown in Figure 3, in our analysis the seedling resistance QTL is a clearly
defined effect and it is mirrored by a multi-environment adult plant resistance
QTL. However, the individual environment adult plant resistance QTL do not meet
the significant threshold in two out of three environments. The heading date
QTL reaches the significance threshold at a point coincident with the seedling
resistance QTL peak, but the LOD values continue to climb toward the terminal
marker, Bmy1. Hayes et al. (1993) also reported
heading date effects in the vicinity of Bmy1, and these may reflect
allelic variation at the sh locus (Takahashi and Yasuda, 1970). We have been
unable to find PCR-based markers to fill the ABG397 – Bmy1
interval in order to better localize this heading date QTL. According to the
consensus and BIN maps (http://barley.genomics.wsu.edu/) Bmy1 is 10 cM from
the end of the chromosome 4(4H) linkage group.
An issue of biological importance concerns the relationship of heading date and adult plant resistance: are these the effects of linked QTL, or is lower disease severity a pleiotropic effect of the latter heading date allele? Our data confirm that seedling resistance and heading date are determined by linked QTL. The relationship of seedling and adult plant resistance is a subject of extensive discussion and analysis (Castro et al., 2002). There is evidence that resistance genes in plants can form clusters (Michelmore, 1995; Kanazin et al., 1996; Ellis et al., 1998). Accordingly, our working hypothesis is that the seedling and adult plant resistance QTL represent the effects of the same, or tightly linked genes, and that the overlap of resistance and heading date is due to linkage rather than pleiotropy.
Conclusions
The first QTL report on this population
was published nearly eight years ago, and yet several key questions remain
unanswered:
-
What is the relationship of the coincident seedling resistance QTL
and the adult plant resistance QTL on chromosomes 1(7H), 4(4H) and 6(6H)? Is
the growth stage at which resistance is expressed due to linkage or pleiotropy?
-
Is there a race-specific component to the coincident seedling and
adult plant resistance QTL, but not to the chromosome 7(5H) resistance QTL,
which is associated only with resistance at the adult plant stage?
-
What are the relationships of morphological and phenological
traits with quantitative resistance?
We are seeking answers to those
questions with new genetic stocks representing pyramids of various combinations
of resistance alleles in single genotypes and with near-isogenic lines of each
resistance QTL allele in a common (BSR susceptible) genetic background.
Figure 1. Linkage map of the Shyri x Galena population. Marker locus names
are on the left side of each linkage group and distances (Kosambi cM) are shown
for each marker interval. New markers added for this paper are in green.
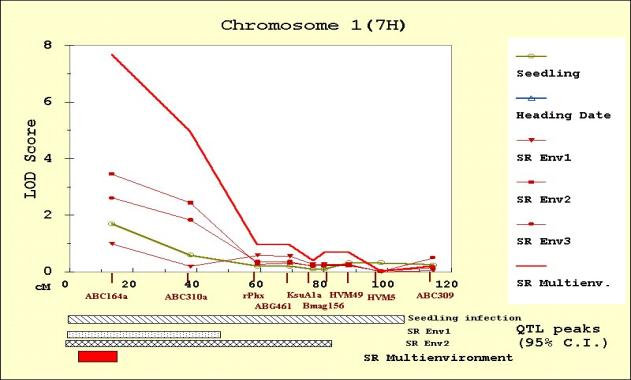
Figure 2. MultiQTL LOD scores on chromosome 1(7H) for seedling resistance, heading date, and adult plant resistance in Env1 (SREnv1), Env2 (SREnv2) and Env3 (SREnv3). The multi-environment analysis of adult plant resistance is represented as SRMultienv. Confidence intervals (95%) for the location of the QTL peaks detected are presented on the bottom of the figure.
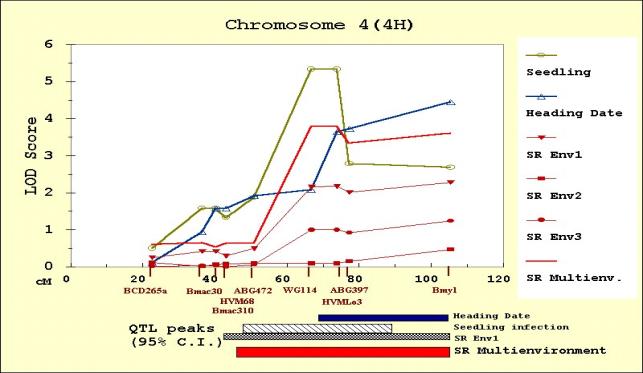
Figure 3. MultiQTL LOD scores on chromosome 4(4H) for seedling resistance, heading date, and adult plant resistance in Env1 (SREnv1), Env2 (SREnv2) and Env3 (SREnv3). The multi-environment analysis of adult plant resistance is represented as SRMultienv. Confidence intervals (95%) for the location of the QTL peaks detected are presented on the bottom of the figure.
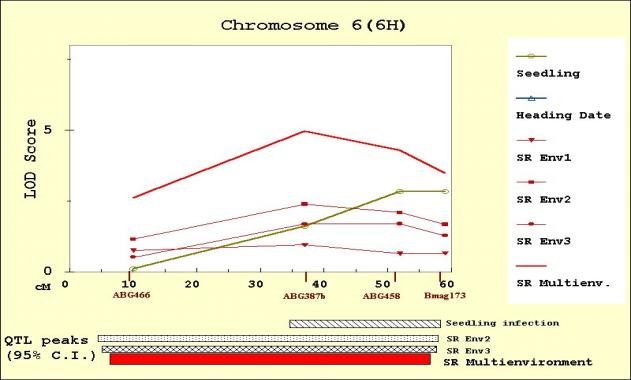
Figure 4. MultiQTL LOD scores on chromosome 6(6H) for seedling resistance, heading date, and adult plant resistance in Env1 (SREnv1), Env2 (SREnv2) and Env3 (SREnv3). The multi-environment analysis of adult plant resistance is represented as SRMultienv. Confidence intervals (95%) for the location of the QTL peaks detected are presented on the bottom of the figure.
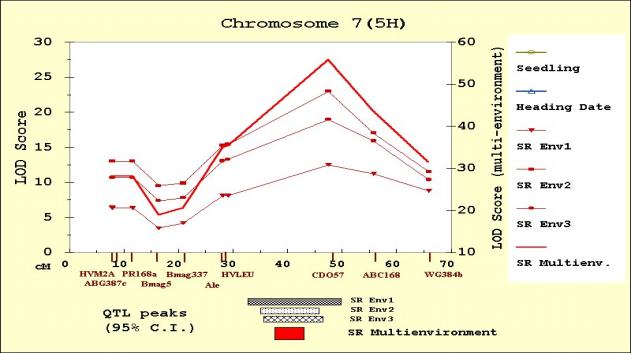
Figure 5. MultiQTL LOD scores on chromosome 7(5H) for seedling resistance, heading date, and adult plant resistance in Env1 (SREnv1), Env2 (SREnv2) and Env3 (SREnv3). The multi-environment analysis of adult plant resistance is represented as SRMultienv. Confidence intervals (95%) for the location of the QTL peaks detected are presented on the bottom of the figure.
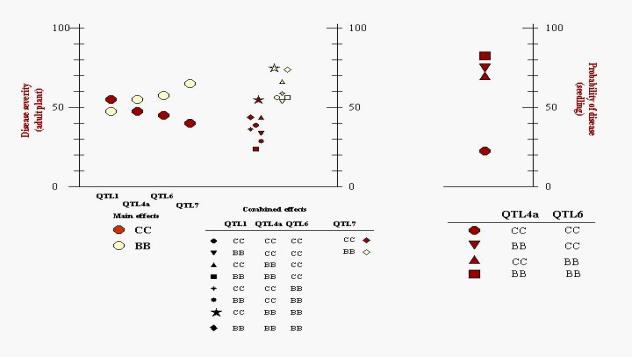
Figure 6. Least square means of the probability of occurrence of the resistant phenotype in individuals with resistance alleles on QTL4, on QTL6, on both QTL4 and QTL6, and with no resistance alleles for each stripe rust race and for all three races (left side). Least square means of adult plant disease severity in individuals with different combination of alleles on QTL1, QTL4a, QTL6 and QTL7 (right side).
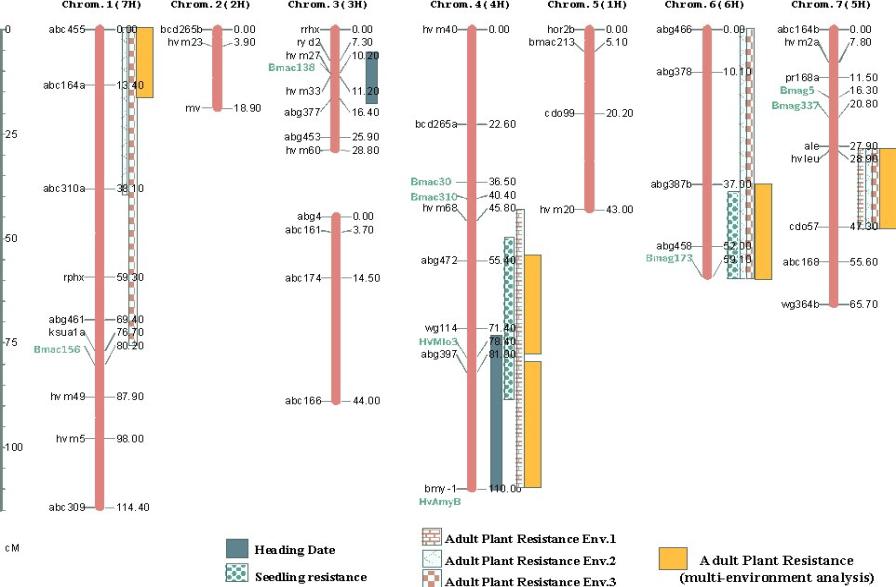
Figure 7. Linkage map of the Shyri x Galena population (same as Figure 1)
showing the location of QTL for seedling resistance, heading date, and adult
plant stripe rust resistance (in individual environments and from
multi-environmental analysis).
References
Castro A, Chen
X, Hayes P.M., Knapp S.J., Line R.F., Toojinda T., Vivar H., 2002. Coincident
QTL which determine seedling and adult plant resistance to stripe rust in
barley. Crop Science, in press.
Castro A., Corey A., Filichkin T., Hayes P.M.,
Sandoval-Islas J.S., Vivar H., 2000. Stripe rust resistance QTL pyramids in
barley. In: S. Logue (ed.), Proceedings of the VII International Barley
Genetics Symposium, Adelaide, 2000. Volume II: 86-88
Chen F.Q., Prehn D., Hayes P.M.,
Mulrooney D., Corey A. and Vivar H., 1994. Mapping genes for resistance to
barley stripe rust (Puccinia striiformis f.sp. hordei). Theor.
Appl. Genet. 88: 215-219
Ellis J.G., G.J. Lawrence, W.K.
Peacock, and A.J. Pryor, 1998. Approaches to cloning plant genes conferring
resistance to fungal pathogens. Ann. Rev. Phytopathology 26: 245-263.
Hayes P.M., Liu B.H., Knapp S.J.,
Chen F., Jones B., Blake T., Franckowiak J., Rasmusson D.C., Sorrells M.,
Ullrich S.E., Wesenberg D., y Kleinhofs A., 1993. Quantitative locus effects
and environmental interaction in a sample of North American barley germplasm.
Theor. Appl. Genet. 87: 392-401.
Hayes, P.M., D. Prehn, H.E. Vivar, T. Blake, A. Comeau, I.
Henry, M. Johnston, B. Jones, and B. Steffenson, 1996. Multiple disease
resistance loci and their relationship to agronomic and quality loci in a
spring barley population. J. Agric. Genomics 2. (www.ncgr.org/jag/)
Hayes P.M., Castro A., Corey A.,
Fillichkin T., Johnson M., Rossi C., Sandoval S., Vales I., Vivar H., Von
Zitzewitz J., 2001. Collaborative stripe rust resistance gene mapping and
deployment efforts. P47-60. In: H.E. Vivar, and A. McNab (eds.). Breeding
barley in the new millennium: Proceedings of an international symposium.
Mexico, DF. CIMMYT. (http://www.css.orst.edu/barley/orbarley/collab.htm
)
Holloway J., and Knapp S.J., 1994. GMendel 3.0 users guide
(http://www.css.orst.edu/G-mendel/Default.htm)
Kanazin V., L.F. Marex, and R.C.
Shoemaker, 1996. Resistance gene analogs are conserved and clustered in
soybean. Proc. Natl. Acad. Sci. (USA) 93: 11746-11750.
Laurie D.A., N. Pratchett, J. H. Bezant, and J. W. Snape. 1995. RFLP mapping of five major genes and eight quantitative trait loci controlling flowering time in a winter x spring barley (Hordeum vulgare L.) cross. Genome 38: 575-585.
Liu Z.-W., R.M. Biyashev, and M.A. Saghai Maroof, 1996. Development of simple sequence repeat markers and their integration into a barley linkage map. Theor. Appl. Genet. 93: 869-876.
McCullagh, P. and Nelder, J.A. 1989. Generalized linear models. Chapman and Hall, London.
Michelmore R., 1995. Molecular
approaches to manipulation of disease resistance genes. Ann.Rev.
Phytopathology. 15: 393-427.
Nelder, J.A. and Wedderburn, R.W.M. 1972. Generalized linear models. J. Royal Statist. Soc. 135: 370-384.
Takahashi R., and Yosuda S.,
1971. Genetics of earliness and growth habit in barley. In R.A. Nolan (ed.),
Barley Genetics II, Washington State University Press. P. 388-408.
Toojinda T., Broers L.H., Chen
X.M., Hayes P.M., Kleinhofs A., Korte J., Kudrna D., Leung H., Line R.F.,
Powell W., Ramsay L., Vivar H., and Waugh R., 2000. Mapping quantitative and
qualitative disease resistance genes in a doubled haploid population of barley
(Hordeum vulgare). Theor. Appl. Genet. 101: 580-589