
Construction
of a barley RFLP linkage map using an F2 population
derived
from a cross between Ko A and Mokusekko 3
C. Miyazaki1, E. Osanai2, K.
Saeki3, N. Hirota3, K. Ito3, Y. Ukai4,
T. Konishi5 and A. Saito6
1 Nagasaki
Laboratory, Japan Science and Technology Corporation,
2-1303-8, Ikeda, Ohmura, Nagasaki 856-0026, Japan
2 Technology
Development Department, Kirin Brewery Co. Ltd.
1-17-1, Namamugi, Tsurumi, Yokohama 230-8628, Japan
3 Biotechnology
Department, Sapporo Breweries Ltd.
37-1, Kizaki, Nitta, Gunma 370-0393, Japan
4 1994-9
Migimomi, Tsuchiura, Ibaraki 300-0837, Japan
5 294
Okada, Mabi, Okayama 710-1311, Japan
6 Department
of Crop Breeding, Kyushu National Agricultural Experiment Station,
2421, Suya, Nishigoshi, Kumamoto 861-1192, Japan
We report on the construction of a barley RFLP
linkage map using 120 F2 plants derived from a cross between Ko A
and Mokusekko 3. Ko A is a Japanese two-rowed malting barley, and Mokusekko 3
is a Chinese six-rowed barley landrace.
Six restriction enzymes BamHI, BglII, DraI, EcoRV, HindIII and XbaI were chosen for the detection of
polymorphism between Ko A and Mokusekko 3. Three sources of the known RFLP
probes were used for the map construction; NABGMP probes (Kleinhofs et al.
1993, Kasha and Kleinhofs 1994), MWG and cMWG probes (Graner et al. 1991), and
BCD, CDO and WG probes (Heun et al. 1991). New barley RFLP probes were
developed in this study. The genomic DNA probes (JBG probes) were obtained from
cultivar Ko A HpaII genomic DNA
library. The cDNA probes (JBC probes) were isolated from cultivar Igri callus
cDNA library. Linkage analysis was performed using Mapmaker version 2.0 with
LOD of 3.0. Genetic distances were calculated using the Kosambi function.
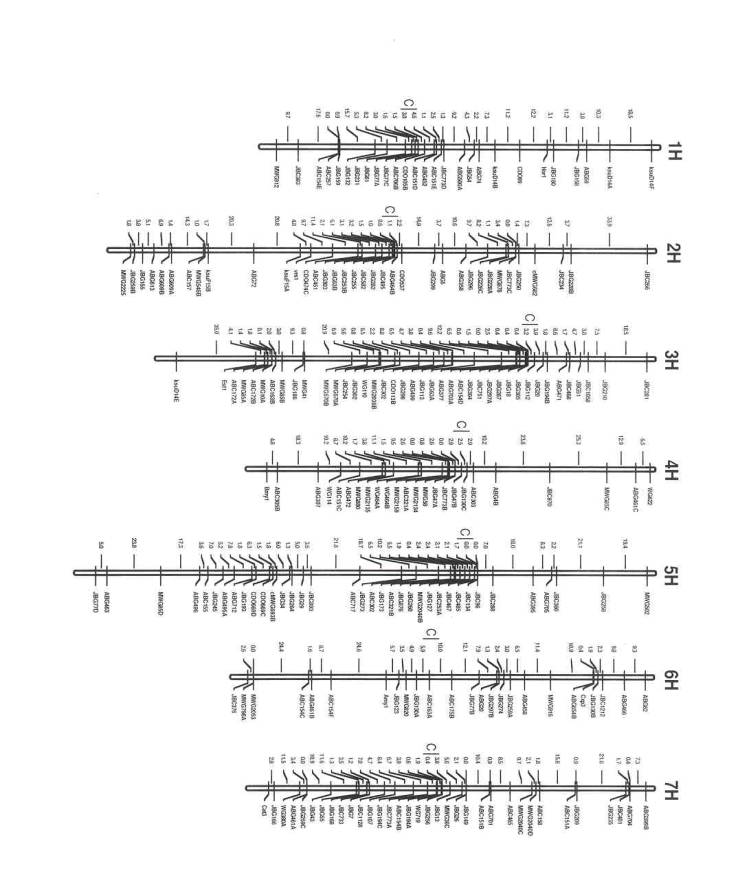
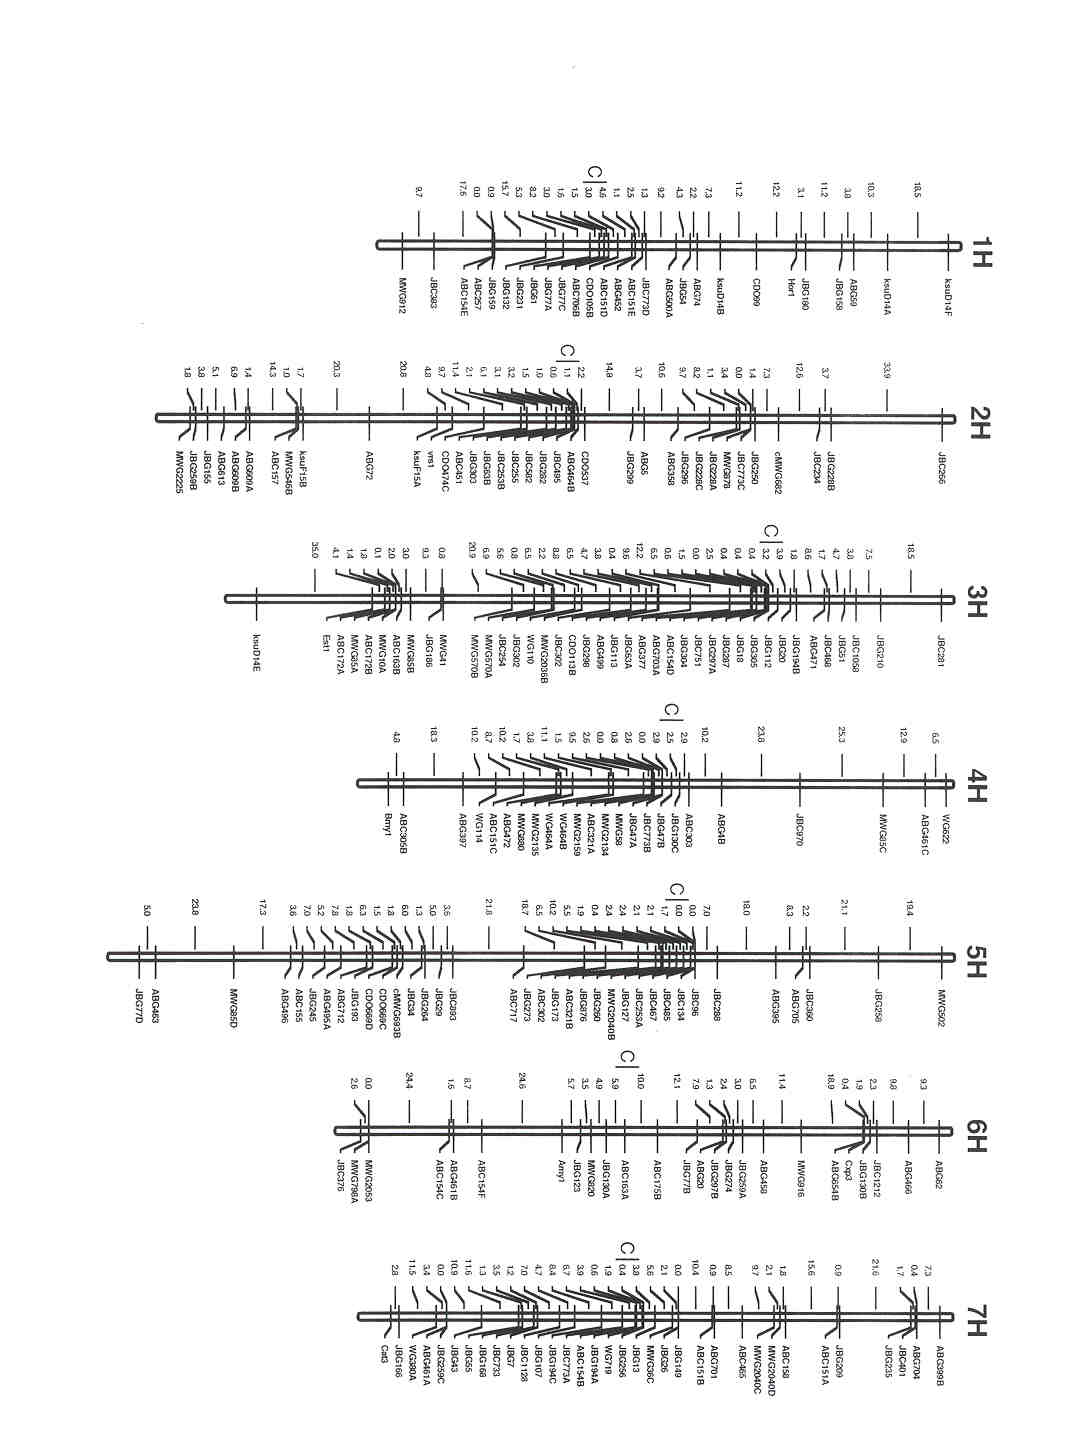
The present map covers 1389 cM of the barley genome
consisting of 222 loci with an average marker-to-marker distance of 6.5 cM
(Fig. 1). These loci include 147 genomic DNA RFLP, 73 cDNA RFLP, one isozyme (Est1) and one morphological (vrs1) markers (Table 1). As common
markers, 117 loci were mapped using the previously reported 91 probes.
Furthermore, 103 loci were newly mapped on the barley genome using 57 JBG
probes and 29 JBC probes. There were only three gap regions exceeding 25 cM.
We compared the present map with the Steptoe x Morex
map, which is one of the most representative barley RFLP linkage maps, based on
a Hordeum bulbosum (Hb)-derived DH
lines (Kleinhofs 1995). The linear orders of common RFLP markers were
essentially identical and no major chromosomal rearrangements were detected.
The ratio of total length between F2 map and Hb-derived DH map
within common markers was 0.98. The remarkable similarities were present at the
whole-genome level between both RFLP linkage maps.
Acknowledgments
We
thank Drs. A. Kleinhofs, A. Graner and M. E. Sorrells for providing RFLP
probes.
References
Kasha, K. J. and A.
Kleinhofs (1993) Mapping of the barley cross Harrington x TR306. BGN 23: 65-69.
Kleinhofs, A., A.
Kilian, M. A. Saghai Maroof, R. M. Biyashev, P. Hayes, F. Q. Chen, N. Lapitan,
A. Fenwick, T. K. Blake, V. Kanazin, E. Ananiev, L. Dahleen, D. Kudrna, J.
Bollinger, S. J. Knapp, B. Liu, M. Sorrells, M. Heun, J. D. Franckowiak, D.
Hoffman, R. Skadsen and B. J. Steffenson (1993) A molecular, isozyme and
morphological map of the barley (Hordeum
vulgare ) genome. Theor. Appl. Genet. 86: 705-712.
Kleinhofs, A. (1995) NABGMP mapping update. BGN 25: 62-70.
Graner, A., A. Jahoor,
J. Schondelmaier, H. Siedler, K. Pillen, G. Fischbeck, G. Wenzel and R. G.
Herrmann (1991) Construction of an RFLP map of barley. Theor. Appl. Genet. 83:
250-256.
Heun, M., A. E. Kennedy, J. A. Anderson, N. L. V. Lapitan, M. E.
Sorrells and S. D. Tanksley (1991) Construction of a restriction fragment
length polymorphism map for barley (Hordeum
vulgare ). Genome 34: 437-447.
|
Table 1. Distribution
of markers and map length of the seven barley chromosomes |
||||||
|
Chromosome |
Length |
ĀĀĀĀĀ Number of markers detected |
|
Gapb |
||
|
|
(cM) |
genomic
DNA |
cDNA |
Othera |
Total |
|
|
1H |
169 |
17 |
10 |
0 |
27 |
0 |
|
2H |
234 |
23 |
12 |
1 |
36 |
1 |
|
3H |
213 |
28 |
11 |
1 |
40 |
1 |
|
4H |
173 |
17 |
7 |
0 |
24 |
1 |
|
5H |
249 |
21 |
15 |
0 |
36 |
0 |
|
6H |
179 |
17 |
8 |
0 |
25 |
0 |
|
7H |
172 |
24 |
10 |
0 |
34 |
0 |
|
Total |
1389 |
147 |
73 |
2 |
222 |
3 |
aIsozyme and
morphological markers
bDistance
between two adjacent markers of more than 25 cM
Fig. 1.Ā (following page) The
barley Ko A x Mokusekko 3 RFLP linkage map with the short arm at the top. The
map distances are given in cM on the left of the bars. The approximate
centromere positions are shown by a C with vertical bar according to the
previous report (Kleinhofs et al. 1993).