SUMMARY OF BARLEY MALTING
QUALITY QTLS
MAPPED IN VARIOUS
POPULATIONS
J.M.Zale1,
J.A. Clancy1, S.E. Ullrich1, B.L. Jones2, P.M.
Hayes 3, and the North American Barley Genome Mapping Project. 1 Department of Crop and Soil
Sciences, Washington State University, Pullman WA 99164-6420, USA, 2
Cereal Crops Research Unit, USDA-ARS, 501 Walnut St., Madison WI 53705, USA, 3 Department of Crop and Soil Science, Oregon
State University, Corvallis, OR 97331, USA.
ABSTRACT Characters that affect malting quality (i.e. malt extract
content, a- and b-amylase activity, diastatic power, malt b-glucan
content, malt b-glucanase activity, grain protein content, kernel
plumpness, and dormancy) are quantitatively inherited and variously influenced
by the environment (E). Conventional
genetic analyses have provided little useful information. Molecular technologies have opened the door
for better understanding of these and other quantitatively inherited traits.
Quantitative trait locus (QTL) analysis identifies chromosome regions, linked
molecular markers, gene effects, QTL X E, and QTL X QTL interactions for a
given trait. Considerable QTL analyses
have been performed in recent years on a number of crosses. The objective of this study was to
accumulate malting quality QTL mapping data published to date to update QTL
designations in relation to consensus molecular markers. Additional molecular markers from an
integrated map were used to anchor specific QTLs across mapping populations. Data has come from crosses of germplasm sources
originating from North America, Europe, Australia and Asia. Based on our
search, a minimum of 168 malting quality QTLs representing 19 malting quality
traits have been mapped in nine mapping populations. QTL regions are spread across each of the seven barley
chromosomes with concentrations especially within chromosomes 1, 2, 4, 5 and
7. Whereas, there is remarkable QTL
conservation in some chromosome regions among crosses, some regions hold unique
QTLs as well. It is also noteworthy
that there are many overlapping QTLs, especially but not surprisingly, of
related traits. Malt extract QTLs are
almost always coincident with component traits such as carbohydrate hydrolytic
enzyme activities. Diastatic power QTLs
are often associated with a- and/or b-amylase activity QTLs.
It is likely that pleiotropy is the cause, but gene clusters cannot be
ruled out at this time. Given that
malting quality determinants are widely distributed across the barley genome,
care must be taken in choosing QTLs for selection in breeding programs. Magnitude of effect, of course, is one
criterion that can be applied. In some
cases widely conserved QTL chromosome regions may be targets for selection to
maintain malting quality, but selection for unique regions may lead to new
improvements. Whereas, understanding of the truly complex traits is far from
complete, great advances in knowledge have been gained.
INTRODUCTION QTL analysis provides a better understanding of the
genetic factors that influence complex traits such as malting quality. This analysis can identify chromosome
regions, linked molecular markers, gene effects, QTL x E and QTL x QTL
interactions that are important in plant improvement. The ability to detect chromosome regions that affect two or more
traits also provides an understanding of the genetic basis for correlation
between traits. A long-term goal of QTL
analysis is to maintain or improve malting quality in barley cultivars through
molecular marker assisted selection.
QTL mapping in barley has
received worldwide attention. The North
American Barley Genome Mapping Project has focussed on the Steptoe/Morex,
Harrington/TR306,and Harrington/Morex
populations, as well as several others.
European researchers have studied the Blenheim/E224/3population and the
Australian workers have concentrated on the Chebec/Harrington, Clipper/Sahara
and Galleon/Haruna Nijo mapping populations.
OBJECTIVES
1) To review the literature on malting quality QTLs in barley and determine whether similar or unique QTLs have been identified among different mapping populations.
2) To create a composite map of each barley chromosome showing the relative locations of all malting quality QTLs from nine mapping populations.
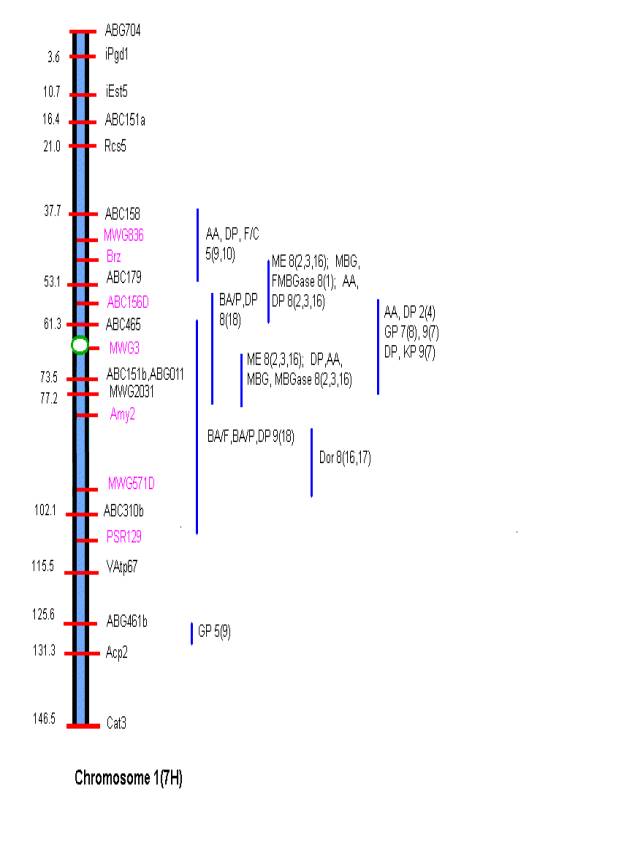
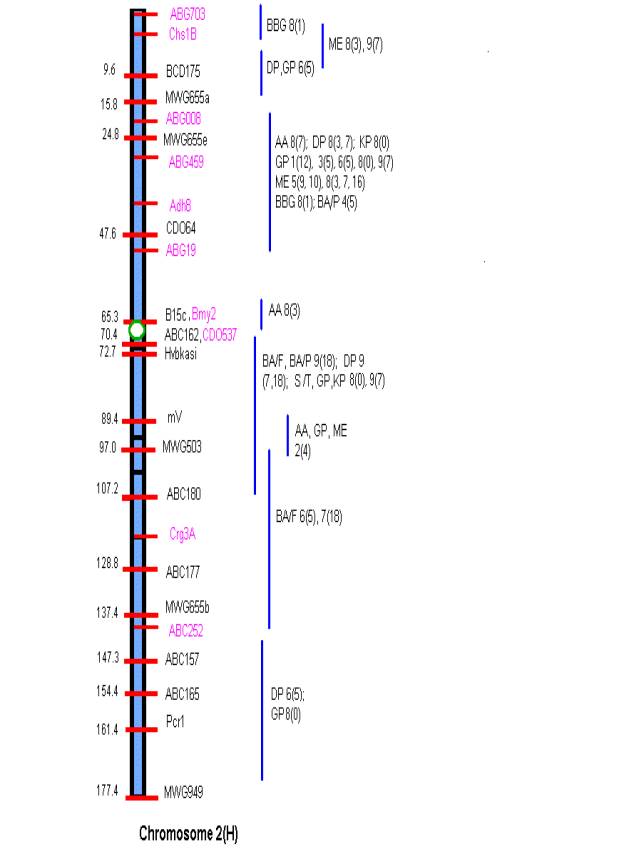
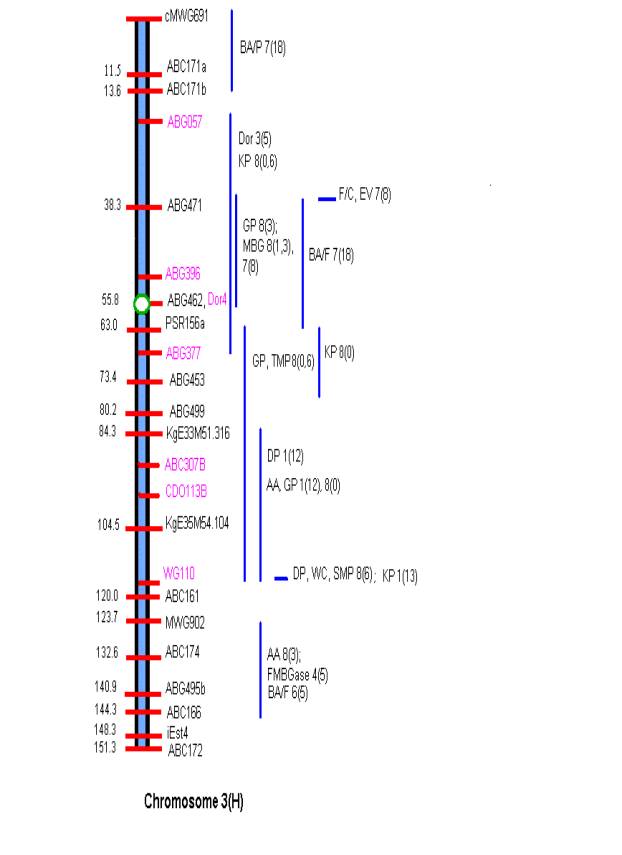
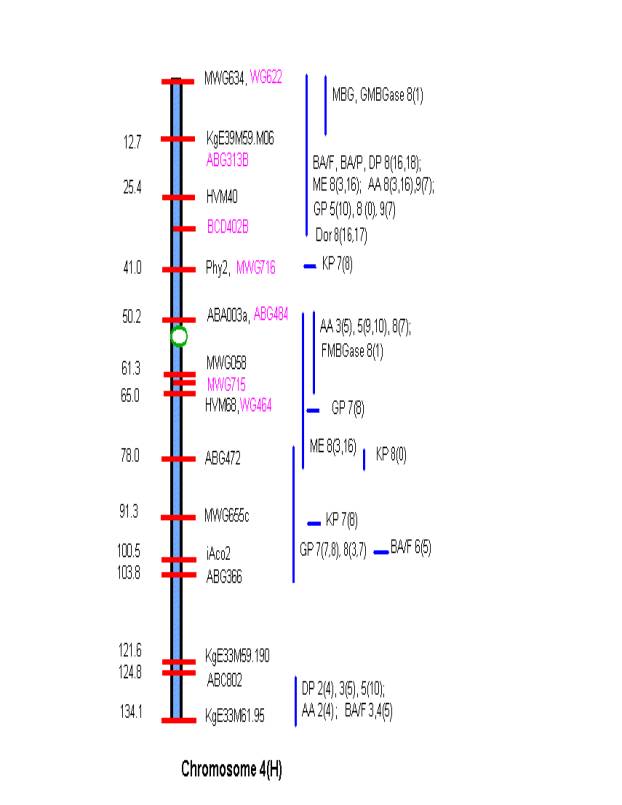
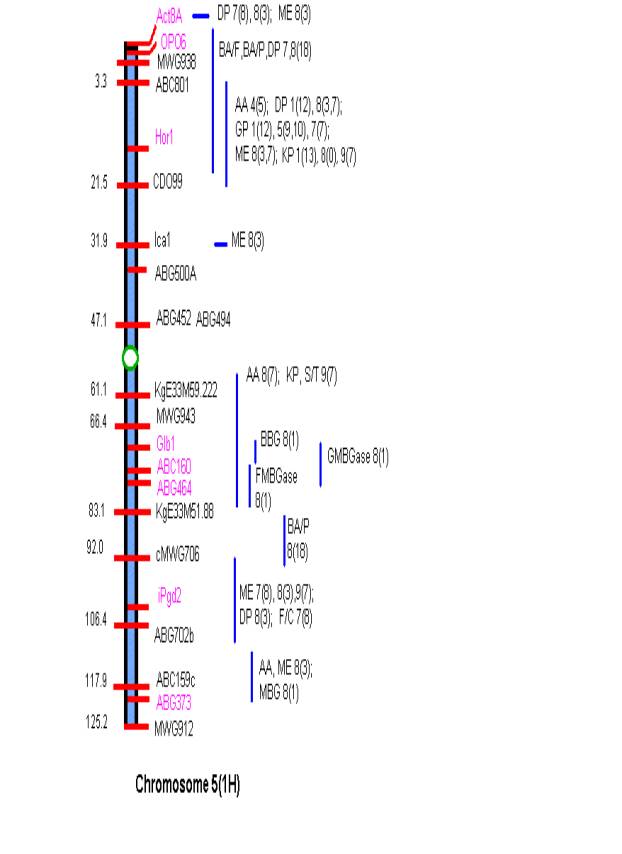
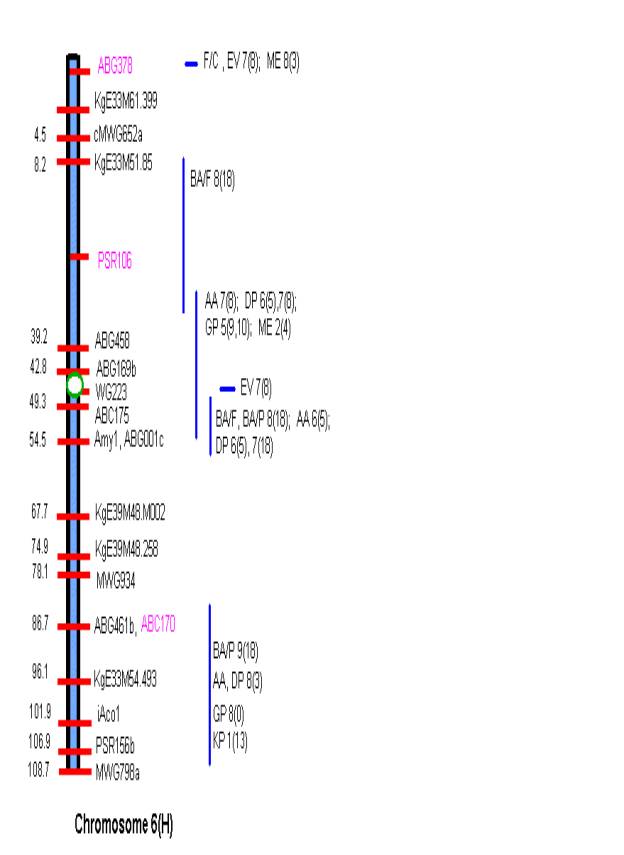
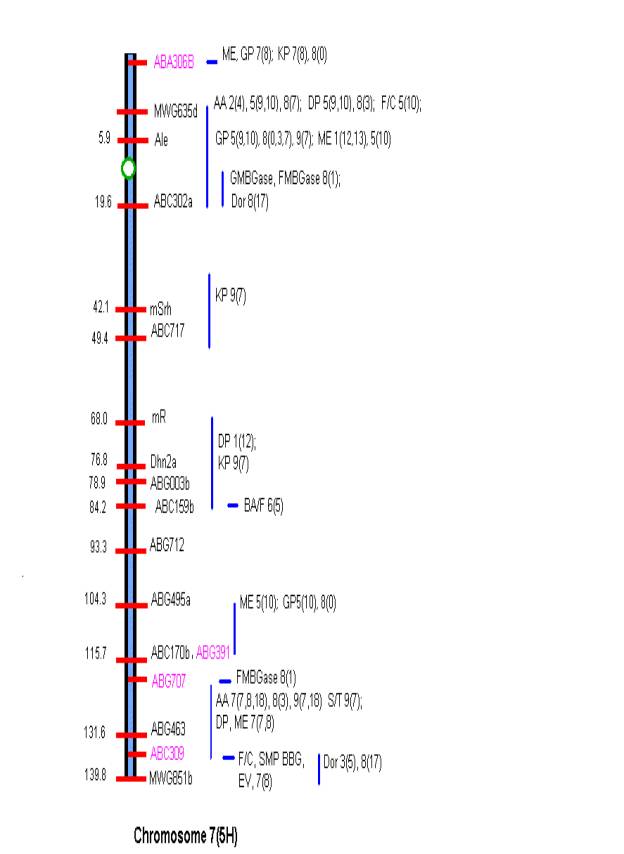
MATERIALS AND METHODS Comprehensive updated maps showing malting quality
QTLs were created by adding all reported malting quality QTLs to the skeleton
maps of Hayes et al. (4). A total of
nine mapping populations with 19 different malt quality QTLs have been
published. New markers (in pink)
necessary for locating reported QTLs were added to the Harrington/Morex
skeleton map of Hayes et al. (4) based on the consensus markers of Qi et al.
(11). Exact locations and even relative
marker positions may vary across the maps of the nine mapping populations. Some QTLs were described by their peak
position in Kosambi map units only and are shown by horizontal bars. Map distances shown are based on the
Harrington/Morex population and may be considered as only approximate. Generally, QTLs are represented by vertical
bars followed by malt quality trait abbreviation, mapping population (1-9), and
reference (0-18). Smaller QTLs that
fell within larger QTLs for the same trait were nested within the larger. The reader is urged to consult the original
publications for more detailed information on allele phase, magnitude of
effect, and the exact QTL position.
RESULTS AND DISCUSSION Among the most important parameters affecting
malting are malt extract percentage, a-amylase activity, diastatic power, b-glucan
content, grain protein percentage and dormancy. Generally, Harrington, Morex, Calicuchima-sib, Haruna Nijo,
Blenheim, and Sahara 3371 contribute superior malting quality alleles. QTLs for many of the malt quality traits are
concentrated in most of the mapping populations on chromosome 1 ABC158-Psr129;
on chromosome 2 ABG008-ABG19; on chromosome 4 MWG634-BCD402B; on chromosome 5
Act8A-CDO99 and KgE33M59.222 –ABC159c; and on chromosome 7 MWG635d-ABC302a and
ABG495a-MWG851b (see Maps). The North
American Barley Genome Mapping Project has most thoroughly characterized the
Harrington/TR306, Steptoe/Morex and Harrington/ Morex mapping populations and
this is evident by the numerous malting quality QTLs for these mapping
populations (see Maps and Table).
There is conservation in
QTLs for grain protein on the short arm of chromosome 2 at ABG459 among five
diverse mapping populations (see Map of Chromosome 2) and in several other
traits throughout the genome. A minimum
of 156 distinct malting quality QTLs were counted for the 19 traits in the nine
mapping populations. Among all of the mapping populations, eighty-four percent
of the malting quality QTLs are coincident.
The fact that many related
malting quality traits occur together may indicate pleiotropic gene effects, or
alternately, the presence of gene clusters.
For example, the maps show that diastatic power is often associated with
a-or b-amylase activity. However, there are cases of diastatic power
not associated with its component enzymes.
This may be due to the enzymes not being assayed independently or due to
lack of polymorphism in the mapping populations. While many QTLs are similar among mapping populations, there are
some apparently unique QTLs present.
Given that malting quality determinants are widely distributed across the barley genome, care must be taken in choosing QTLs for selection in breeding programs. Magnitude of effect is one criterion that can be applied. Widely conserved QTL chromosome regions may be targets for selection to maintain malting quality, but selection for unique regions may lead to new improvements.
REFERENCES
Han,F. and
Ullrich, S.E. 1994. Mapping of QTLs
associated with malting quality in barley.
Barley Genet. Newslltr. 23:84-97.
Han, F., Ullrich, S.E., Chirat, S.,
Menteur, S., Jestin, L., Sarrafi, A., Hayes, P.M., Jones, B.L., Blake, T.K.,
Wesenberg, D.M., Kleinhofs, A., and Kilian, A. 1995. Mapping of b-glucan content and b-glucanase activity loci in barley
grain and malt. Theor. Appl. Genet. 91:921-927.
Han, F., Ullrich, S.E.,
Kleinhofs, A., Jones, B.L., Hayes, P.M., and Wesenberg, D.M. 1997. Fine
structure mapping of the barley chromosome-1 centromere region containing
malting-quality QTLs. Theor. Appl. Genet. 95:903-910.
Hayes, P.M., Liu, B.H.,
Knapp, S.J., Chen, F., Jones, B., Blake, T., Franckowiak, J., Rasmusson, D.,
Sorrells, Ullrich, S.E., Wesenberg, D., and Kleinhofs, A. 1993. Quantitative
trait locus effects and environmental interaction in a sample of North American
barley germplasm. Theor. Appl. Genet. 87:392-401.
Hayes, P.M., Cerono, J., Witsenboer,
H., Kuiper, M., Zabeau, M., Sato, K., Kleinhofs, A., Kudrna, D., Kilian, A.,
Saghai-Maroof, M., Hoffman, D., and the North American Barley Mapping Project.
1997. Characterizing and exploiting genetic diversity and quantitative traits
in barley (Hordeum vulgare). J. Quant. Trait Loci 3(2) Avail. WWW: http://probe.nalusda.gov:8000/otherdocs/jqtl.
Karakousis, A., Kretschmer, J.,
Manning, S., Chalmers, K., and Langridge, P.
1996. The Australian barley
genome mapping project. Available:
WWW: http://greengenes.cit.cornell.edu/WaiteQTL
Larson, S.R., Habernicht, D.K., Blake,
T. K., and Adamson, M. 1997. Backcross for six-rowed grain and malt qualities
with introgression of a feed barley yield QTL.J. Am. Soc. Brew. Chem. 55:52-57.
Marquez-Cedillo, L.A.,
Hayes, P.M., Jones, B.L., Kleinhofs, A., Legge, W.G., Rossnagel, B.G., Sato,
K., Ullrich, S.E., Wesenberg, D.M., and The North American Barley Genome
Mapping Project. 2000. QTL analysis of
malting quality in barley based on the doubled haploid progeny of two elite
North American varieties representing different germplasm groups. Theor.Appl.
Genet. (in press).
Mather, D.E., Tinker, N.A., LaBerge,
D.E., Edney, M., Jones, B.L., Rossnagel, B.G., Legge, W.G., Briggs, K.G.,
Irvine, R.B., Falk, D.E., and Kasha, K.J. 1997. Regions of the genome that
affect grain and malt quality in a North American two-row barley cross. Crop
Sci. 37:544-554.
Oziel, A., Hayes, P.M., Chen, F.Q., and
Jones, B. 1996. Application of quantitative trait locus mapping to the
development of winter-habit malting barley. Plant Breeding 115:43-51.
Pan, A., Hayes, P.M., Chen, F., Chen,
H.H., Blake, T., Wright, S., Karsai, I., and Bedo, Z. 1994. Genetic analysis of
the components of winterhardiness in barley (Hordeum vulgare L.). Theor. Appl. Genet. 89:900-910.
Qi, X., Stam, P., and Lindout, P. 1996. Comparison and integration of four
barley genetic maps. Genome 39:379-394.
Thomas, W.T.B., Powell, W., Swanston,
J.S., Ellis, R.P., Chalmers, K.J., Barua, U.M., Jack, P., Lea, V., Forster,
B.P., Waugh, R., and Smith, D.B. 1996. Quantitative trait loci for germination
and malting quality characters in a spring barley cross. Crop Sci. 36:265-273.
Thomas, W.T.B., Powell, W., Waugh, R.,
Chalmers, K.J., Barua, U.M., Jack, P., Lea, V., Forster, B.P., Swanson, J.S.,
Ellis, R.P., Hanson, P.R., and Lance, R.C.M. 1995. Detection of quantitative
trait loci for agronomic, yield, grain and disease characters in spring barley
(Hordeum vulgare L.). Theor. Appl.
Genet. 91:1037-1047.
Tinker, N.A., Mather, D.E., Blake,
T.K., Briggs, K.G., Choo, T.M., Dahleen, L., Dofing, S.M., Falk, D.E.,
Ferguson, J.D., Frankowiak, J.D., Graf, R., Hayes, P.M., Hoffman, D., Irvine,
R.B., Kleinhofs, A., Legge, W., Rossnagel, B.G., Saghai-Maroof, M.A., Scoles,
G.J., Shugar, L.P., Steffenson, B., Ullrich, S.E., and Kasha, K.J. 1996. Loci
that affect agronomic performance in two-row barley. Crop Sci. 36:1053-1062.
Tinker, N. The North American Barley
Mapping Project (NABGMP) in Canada. 10 Jan. 1996. NABGMP, Canada, 12 Apr. 1999,
Available: WWW: http://gnome.agrenv.msgill.ca/nabgmp/cnabgmp.htm.
Ullrich, S.E. and Han, F. 1997. Genetic complexity of the malt extract
trait in barley suggested by QTL analysis.
J. Am. Soc. Brew. Chem. 55:1-4.
Ullrich, S.E., Han, F., Blake, T.K.,
Oberthur, L.E., Dyer, W.E., and Clancy, J.A. 1995. Seed dormancy in barley:
genetic resolution and relationship to other traits. p. 157-163. In K. Noda and D.J. Mares (ed.).
Pre-harvest sprouting in cereals 1995. Center for Academic Societies, Osaka,
Japan.
Ullrich, S.E., Han, F., and Clancy, J.A. 1998. Comparative mapping of beta-amylase activity loci among three barley crosses. Plant & Animal Genome VI International Conference (Jan. 18-22, San Diego). Final Program and Abstracts Guide, p 125.
Table
1. Incidence of malting quality QTLs: mapping population vs. chromosome number.
Mapping
Population
|
1(7H) |
2(2H) |
3(3H) |
4(4H) |
5(1H) |
6(6H) |
7(5H) |
|
Blenhem/ E224-3 |
|
GP |
DP, GP KP |
|
DP, GP, KP |
KP |
ME, DP |
|
Calicuchima-sib/Bowman |
AA, DP |
AA, GP ME |
|
DP, AA |
|
ME |
AA |
|
Chebec/ Harrington |
|
GP |
Dor |
DP,
AA BA/F |
|
|
Dor |
|
Clipper/ Sahara |
|
BA/F |
FMB- Gase |
BA/F |
AA |
|
|
|
Dicktoo/ Morex |
AA, DP F/C, GP |
ME |
|
GP, AA, DP F/C |
GP |
GP |
AA, DP F/C, GP ME |
|
Galleon/ Haruna Nijo |
|
DP,
GP BA/F |
BA/F |
BA/F |
|
DP AA |
BA/F |
|
Harrington/ TR306 |
GP |
BA/P |
BA/P BA/F F/C,
EV MBG |
Dor,
KP,GP |
DP,
ME, GP BA/F,
BA/P F/C |
F/C,
EV, AA, DP |
ME,
KP GP,
AA DP, F/C SMP BBG,
EV |
|
Steptoe/ Morex |
ME, MBG FMBGaseMBGase Dor, AA DP, BA/P |
BBG ME, DP AA,GP KP |
KP, GP MBG TMP AA, DP WC, SMP |
MBG,BA/P BA/F, DP, AA ME, GP, Dor FM/GMBGase |
DP, ME, AA KP, BA/F BA/P, BBG MBG FM/GMBGase |
ME BA/P BA/F AA DP GP |
AA, DP GP FM/ GMBGase Dor, KP |
|
Harrington/ Morex |
GP, DP, KP, BA/F BA/P |
ME,GPBA/F BA/P DP, KP S/T |
|
GP |
KP |
BA/P |
GP, KP AA, S/T |
Ledgend: AA- a amylase; BA/F- b amylase activity, U/g flour; BA/P- b amylase activity, U/mg protein; BBG- barley b-glucan; Dor- seed dormancy;
DP- diastatic power; EV- extract viscosity; F/C- fine-coarse difference;
FMBGase- finished malt b-glucanase; GMBGase- green malt b-glucanase; GP- grain protein; KP- kernel
plumpness; MBG- malt b-glucan; MBGase- malt b-glucanase; ME- malt extract;
SMP- soluble malt protein; S/T-soluble /total protein ratio; TMP- total malt
protein; WC- wort clarity.