

John Innes Centre
Norwich Research Park
Colney, Norwich, NR4 7UH, UK
Abstract
Transgenic barley lines grown in a small-scale field experiment were found to perform as well as non-transformed control plants and controls from tissue culture-derived parents, for several agronomic traits, including yield. For other traits, in particular height, a significant difference was seen between transgenic lines and controls.
Introduction
Barley is one of the world's major cereal crops but has proved to be one of the most difficult to genetically modify. However, there are now a number of reports of the successful generation of fertile transgenic barley, for example Wan and Lemaux, 1994 and Koprek et al. 1996. The majority of these reports utilised particle bombardment as the method of DNA delivery and immature embryos as the target tissue. Nevertheless, there has been only one reported study of the agronomic performance of transgenic barley grown under field conditions. In this, Bregitzer et al. (1998) tested for the presence of somoclonal variation by comparing transgenic lines to non-transformed parent plants of the variety Golden Promise in field trials carried out in the US in 1994 and 1996. We report here on the performance of transgenic barley lines of the variety Golden Promise grown in the field in the UK during 1998. Transgenic lines were compared to non-transformed controls and to non-transformed plants from tissue culture derived parents.
Materials and Methods
Generations derived from two transgenic barley lines were included in the trial. These were produced using the BioRad PDS 1000/He particle delivery device to introduce DNA to immature embryos of the spring variety Golden Promise, (Harwood et al. submitted to Euphytica). Line HB1 contains the plasmid pAHC25 (Christensen and Quail, 1996) and line HC1 contains plasmids pAL51 and pAL74 (Lonsdale et al. 1995). Both pAHC25 and pAL51 contain the bar gene, encoding herbicide resistance, as a selectable marker as well as a reporter gene, gus or luc respectively, and pAL74 contains a fungal glucoamylase gene. Both T1 and T2 generations of line HB1 were represented in the trial, where T0 was the primary transformant. Only the T1 generation of HC1 was included. Lines HB1 and HC1 were selected for the field trial from a number of transgenic lines in the glasshouse. These lines were chosen on the basis of a visual selection for normal appearance and full fertility. Both lines had normal chromosome number and showed the expected single gene segregation in the T1 generation.
The trial site consisted of two replicate blocks, each comprised of three beds containing 5 row plots of each of 12 different lines, individually randomised, and each separated by three rows of a non-transformed guard variety Chariot. Each row was sown with 11 seeds. The entire site was also surrounded by 1m wide beds of the guard variety. Lines 1-3 were T2 plants from three different homozygous T2 plants of HB1. Lines 4-6 were T1 plants from three different clonal T0 plants from the HB1 transformation event. Lines 7-9 were T1 plants from three different clonal T0 plants from transformation event HC1. Line 10 was the T1 from a tissue culture derived plant regenerated from an immature embryo in the same way as the transformed plants, but without the transformation step. Lines 11 and 12 were controls of seed derived Golden Promise lines.
During the trial, carried out from March to August 1998, a number of measurements were made on each of the 12 lines including average germination per row, final plant height, average time of flowering (ear emergence), tiller number per row, plot biomass and plot yield. At harvest, a single tiller from each transgenic plant within each plot was harvested separately and seed from these tillers was used to determine 100 seed weight and grain number per tiller for each line. The rest of each plot was harvested by hand and threshed using a Wintersteiger single plant thresher. The data from the trial was analysed using a two-way analysis of variance to examine variation between the two blocks and between lines. Comparisons between particular lines were made using Fisher's protected least significant difference.
Results and Discussion
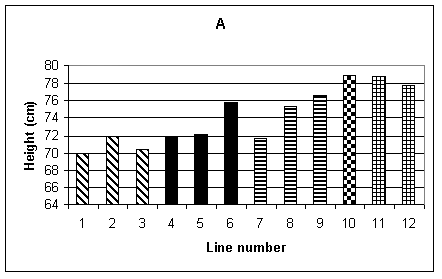
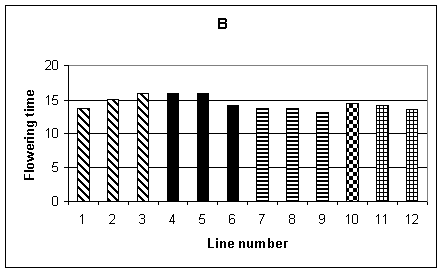
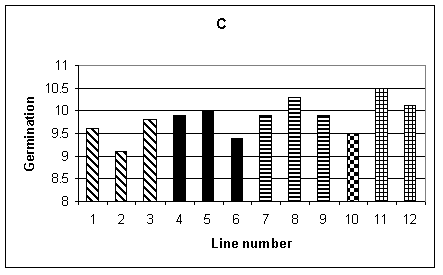
Histograms showing the mean performance of the 12 lines for the different agronomic traits are given in Fig.1 A-F. Plant height was recorded by making three measurements for each row, therefore 15 measurements per plot and a total of 30 measurements for each line. Fig. 1A shows the mean height of each line. It can be seen that, in general, the transgenic lines (1-9) were shorter than the non-transformed controls (10-12). The difference between the lines was significant at the 1% level, but there was no significant difference between the tissue culture control (line 10) and the seed controls (lines 11 and 12). Mean flowering time, shown in Fig. 1B, is given in days from 1st June when 50% of the plants in each row flowered. The analysis of variance showed a difference, significant at the 1% level, between lines. Lines 3-5 were significantly later flowering than the controls. Fig. 1C shows the average germination per row, the maximum being 11. In this case the difference between lines was not significant.
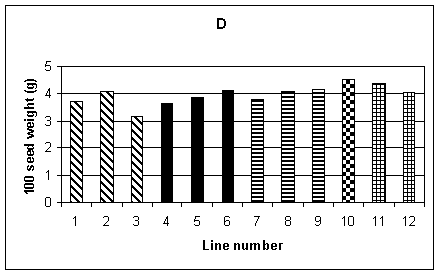
A number of measurements were used to examine yield and its components. The 100 seed weight from the sample tillers is shown in Fig. 1D. No significant difference was found between lines. Similarly, the average weight of seed per plant, over the whole plot, again showed no significant difference between lines (Fig. 1E). The mean number of tillers per plant was obtained from recording the total number of tillers per row and dividing by the number of plants. This is shown in Fig. 1F, and a difference between lines, significant at the 5% level, was found. However, one of the lines with the lowest number of tillers per plant was control line 12. Other measurements carried out included mean plant biomass, grain number per tiller from the sample tillers and average yield per tiller for the sample tillers. Of these measurements, the only one which showed a significant difference between lines was yield per tiller from the sample tillers. However, when the yield from the entire plot was considered there was no significant difference between lines. The limited sample provided by the sample tillers was therefore not representative of the entire plot.
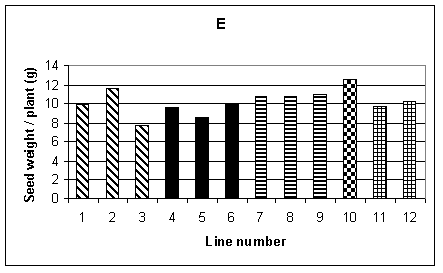
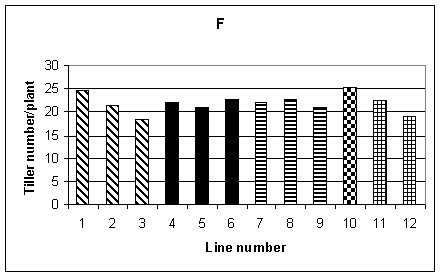
To summarise, for the two transgenic lines included in this trial, HB1 and HC1, both lines performed as well as the controls in terms of yield. The transgenic plants were, however, significantly shorter than the controls and some of the transgenic lines were later flowering. It was interesting to note that line 10, the tissue culture derived control, performed as well as the seed controls for most of the agromonic traits recorded. Therefore, for this tissue culture derived line, we saw no evidence that somoclonal variation resulting from the tissue culture procedures had affected yield or other characteristics. This suggests that the transformation process itself was responsible for the differences seen in the transgenic lines.
Bregitzer et al. (1998) reported a significant reduction in yield in a population of null segregants from transgenic lines compared to control plants. Although these null segregants did not contain any transgenes they were still derived from transgenic lines which had been subjected to herbicide selection as well as the in vitro tissue culture regeneration procedure. These authors suggest that the transformation and selection process generates additional somoclonal variation compared to the in vitro culture alone. The results of our trial support this suggestion in that control line 10 performed as well as the seed controls and this had been subjected only to the in vitro culture, not the transformation and selection. In addition, we observed reduced height and later flowering in transgenic lines which could have been due to the transformation and selection. However, in terms of yield from the transgenic lines, we did not see any significant reduction compared to the controls. The initial selection of the lines to be included in the field trial on the basis of appearance when grown under glasshouse conditions was probably one of the reasons for the good performance of the transgenic lines in terms of yield. Further field trials of lines HB1 and HC1 along with additional transgenic lines will provide additional information on the effect of the transformation process on agronomic performance.
Acknowledgements
This work was supported by the Ministry of Agriculture, Fisheries and Food (MAFF) as part of the Crop Transformation Initiative and by the Biotechnology and Biological Sciences Research Council. We thank P. Quail for the gift of plasmid pAHC25.
References
Bregitzer, P., S.E. Halbert & P.G. Lemaux, 1998. Somoclonal variation in the progeny of transgenic barley. Theor Appl Genet 96: 421-425.
Christensen, A. H. & P.H. Quail, 1996. Ubiquitin promoter-based vectors for high-level expression of selectable and/or screenable marker genes in monocotyledonous plants. Transgenic Research 5: 213-218.
Koprek T., R. Hansch, A. Nerlich, R.R. Mendel & J. Schulze, 1996. Fertile transgenic barley of different cultivars obtained by adjustment of bombardment conditions to tissue response. Plant Science 119: 79-91.
Lonsdale D. M., L.J. Moisan & A.J. Harvey, 1995. pFC1 to 7: A novel family of combinatorial cloning vectors. Plant Molecular Biology Reporter 13: 342-345.
Wan Y. & P.G. Lemaux , 1994. Generation of large numbers of independently transformed fertile barley plants. Plant Physiol 104: 37-48.