Xiong ShouFu, Wen FengJun, Jie RunSheng
(Agricultural Science Research Institute of Nan Chong, Si Chuan, China)
Abstract
By means of path analysis of heritability correlation coefficients, we found that ear length and grain weight per ear have a great direct influence on plot yield, whereas effective and ineffective grain number per ear have little direct influence on the plot yield but they have considerable indirect negative influence on plot yield through other characters. Total grain number per ear has a considerable direct negative influence on plot yield. Plant height has a considerable indirect positive influence on plot yield through other characters.
Key words : barley, quantitative character, genetic correlation coefficient, path analysis, optimal regression equation.
In recent years, breeding of new barley varieties with good quality and high yield has been regarded as a very important research problem by agricultural science researchers in our country,and many new varieties of barley with good quality and high yield have been developed. A set of new barley lines has been evaluated by the barley breeding research group of the Agricultural Science Research Institute of NanChong. This paper gives results of path analysis of genetic correlation for eight main quantitative characters of this set of new barley lines and investigates the relationship between each quantitative character and yield, in order to supply a reliable basis for selecting barley with high yield.
1. Materials and Methods
1.1 Materials used
In 1988, in the evaluation experiment of new barley lines in our Institute, there were forty-nine new barley lines, such as 8902, 88-5601, 87-0046, 85-8826, etc, and Hanshu No.3 in contrast. The experiment was designed by means of random region-groups and repeated three times. The plot area was 13.33m2. We grew peanuts in the front and drilled seeds in seven row-region and narrow strip. The seeds were sown on Nov.12. For statistical analysis, fifth plants at diagonal three points in each region were selected as samples and twenty of these plants were investigated before harvesting.
1.2 Statistics methods
1.2.1 Regarding the average value of regions as one unit, we calculated each character's heritability, coefficient of genetic variation and correlation heritability of genetic correlation coefficients by means of variance and covariance.
1.2.2 We conducted a path analysis of genetic correlation coefficients of all characters.
1.2.3 We calculated the path coefficient and examine its notability, to determine the selection of arguments. We set up an optimal regression equation by selected notable characters.
1.2.4 All the above calculations were carried out by IBM-PC micro-computer.
2. Results and Analysis
2.1 Genetic parameter estimation of each character of barley.
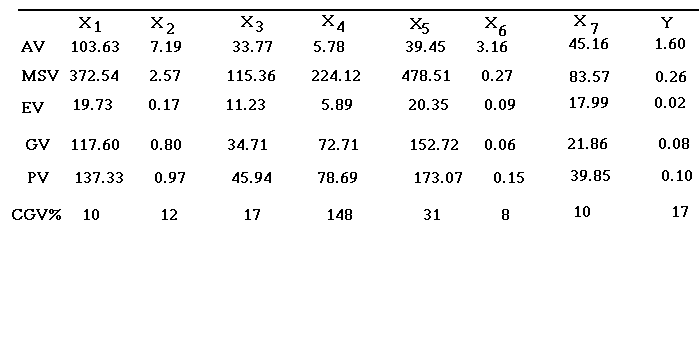
Table 1 Average values, variances and coefficients of genetic variation of eight quantity characters of barley.

In Table 1, AV refers to Average value, MSV refers to Mean Square of variety, EV refers to Environment Variance, GV refers to Genetic Variance, PV refers to phenotype Variance and CGV refers to Coefficient of genetic variation. From Table 1, among all the coefficients of genetic variation, that of ineffective grain number per ear (X4) is 125% and the biggest, and that of total gain number per year (X5) is 31%. This indicates that the coefficients of genetic variation of these two characters are bigger than others, so it is easy to obtain ideal characteristic of breeding object in the selection of the hybrid progenies. The coefficients of genetic variation of effective grain number per year (X3),plot yield (Y), length of ear and plant height are between 10% and 18%. This means that they are comparatively stable characters of good barley.
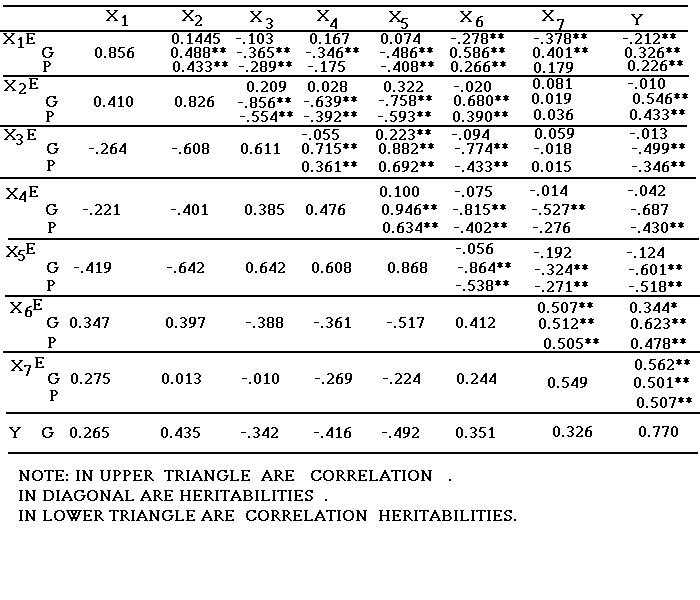
Table 2 Correlation coefficients,correlation heritabilities and heritabilities
of eight characters of barley. 
From the correlation analysis among eight characters in Table 2, the genetic correlation coefficient is bigger than the phenotype correlation coefficient and the latter is bigger than the environment correlation coefficient. The genetic correlation coefficients between each of the seven cause characters, which are plant height (X1), ear length (X2), effective grain number per ear (X3), ineffective grain number per ear (X4), total grain number per ear (X5), weight of one hundred grains (X6) and weight per grain (X7), and the effect character--plot yield (Y), have the following order in absolute value : Rg4y>Rg6y>Rg5y>Rg2y>Rg7y>Rg3y>Rg1y. X6, X2, X7, X1 correlate greatly with Y (r1450.05=0.162, r145.001=0.212). X3, X4 and X5 correlate greatly and negatively with Y. The correlation heritabilities between each of the seven characters and Y have the same order with the genetic correlation coefficients in absolute value.


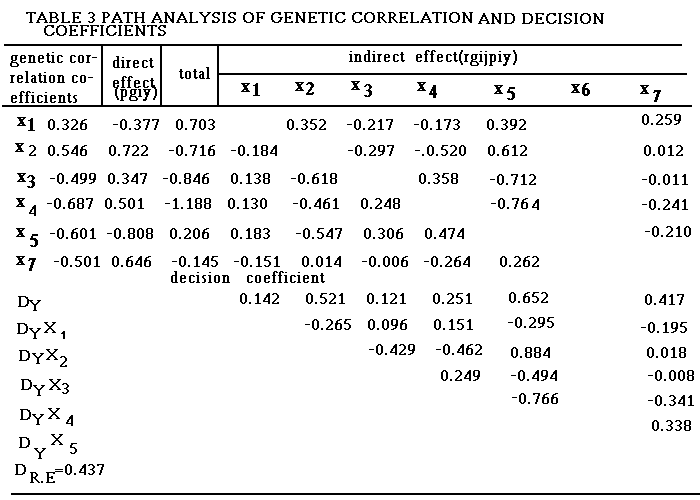
We calculated the path coefficient and examined its notability from the seven characters and plot yield in Table 3. The weight of one hundred grains (X6) has little influence on plot yield (Y), but the other characters have a considerable influence on plot yield. Those are discussed as follows. X2 and X7 have the biggest direct influence on y (P2y = 0.722 and P7y = 0.646). Through the others, they have very little indirect influence on Y (SUM[rg2yP2y]= -0.176 and SUM[rg7yP7y] = -0.145). Although the indirect influence counteracts the direct influence, the genetic correlation coefficients are very large (rg2y = 0.546 and rg7y = 0.541). Therefore, X2 and X7 are two ideal characters for indirect selection of high-yielding varieties of barley by the genetic correlation of characters. And ear length and grain weight are still two important characters determining barley yield.
X3 and X4 have a great direct influence on Y (P3y = 0.347 and P4y = 0.501). Through the others they have a greater indirect negative influence on Y (SUM[rg3y] = -0.846 and (SUM[rg4yP4y] = -1.188). Although the direct influence counteracts the indirect influence, the genetic correlation coefficients are large and negative (rg3y = -0.499 and rg4y = -0.687), indicating considerable negative correlation. This means that the more effective grain, the more ineffective grain, but the lower the yield, illustrating the peculiarity of barley varieties. The yield of polygon-style barley which is has short ears, many grains, small grains and many ineffective grains, is lower than that of bigon-style barley which has long ears, big ears and big grain.
X5 has a considerable negative influence on Y (P5Y = -0.808). This means that it is the biggest direct negative influence among the seven characters. But through the others its total indirect influence on Y is positive (SUM [rg5yP5y] = 0.206), because the total positive influence through X3, X4 and X1 (P4-y = 0.474, P3-y = 0.306 and P1-y = 0.183) is bigger than the total indirect influence on Y through X2 and X7 (P2-y = -0.547 and P7-y = -0.210). Then although the indirect influence counteracts the direct influence, the genetic correlation coefficient is large and negative. Therefore, X5 is not a good character, because it means many grains but low yield. This agrees with the actual situation for barley. Bigon-style barley ihas few grains, big ears, heavy grains and high yield. Polygon-style barley has short ears, many grains (including ineffective grains), small grains and low yield.
X1 has a big direct negative influence on Y (P1y = -0.377). Through the others its total indirect influence on Y is very great (SUM[rg1yP1y] = 0.703), because the total positive influence on Y through X2, X5 and X7 (P2-y = 0.325, P5-y = 0.392 and P7-y = 0.259) is bigger than the total indirect influence through X3 and X4 (P3-y = -0.127 and P4-y = -0.137). Although the direct influence counteracts the indirect influence, the genetic correlation coefficient is big. Therefore, X1 is a ideal auxiliary character.
Furthermore, we carried out regression analysis. We selected the optimal regression equation by means of path analysis. By examining the notability of path coefficients, we eliminated X6 because it is not notable. The we can omit the calculating process of Gauss multiplicator. We set up an optimal regression equation concerning the six notable characters : X1, X2, X3, X4, X5, X6, X7 (Table 4). From the regression equation, we know the regression relationship between each of the characters and the plot yield. The partial regression coefficients of X7, X4 and X3 are positive. And these three characters have a big influence on Y. Then we know that big ear and heavy ear are still important characters to determine Y. The partial regression coefficient of X5 is large and negative. This means the higher the total grain number per ear, the lower the yield. The partial regression coefficient of X1 is very small and negative. This means that the taller the plant, the lower the yield.
3. Discussion
Through the path analysis of genetic correlation, we calculated the genetic correlation coefficients between plot yield and each of the seven characters : plant height, ear length, effective grain number per ear, ineffective grain number per ear, total grain number per ear, weight of one hundred grains and weight of one grain. All of these characters except the weight of one hundred grains have notable influence on plot yield. Ear length and grain weight have a big direct influence on Y. They are two important characters in indirect selection of high-yielding barley by means of the genetic correlation of characters. The characters of grain number, including effective and ineffective grain number, have a considerable negative influence on the plot yield. And total grain number per ear has a considerable direct negative influence on the plot yield. But through genetic correlation, the three characters of grain number correlate greatly and negatively with plot yield. Therefore it is not very good to pursue many grains in the selection of characters of grain number. Plant height has a considerable indirect influence on the plot yield, this is because it correlates greatly and positively with length of ear, total grain number per ear and weight of grain but correlates greatly and negatively with effective and ineffective grain number per ear. Consequently, they are ideal auxiliary characters for indirect selection of high-yielding barley varieties by means of the genetic correlation of characters.
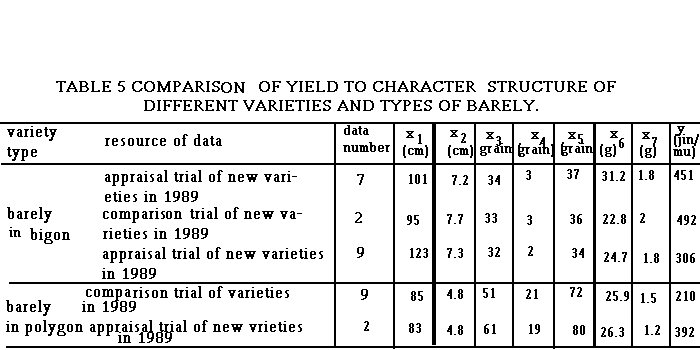
According to the above analysis, we can select suitable characters in practice of breeding. For plant height, neither tall nor short varieties are good. Plants of intermediate height will have enough growing quantity and will result in big ear, many grains and heavy grains. For grain structure, bigon-style barley has big ears, intermediate grain number, big and heavy grain, and high yield. Polygon-style barley (including quadragon and hexagon) has of short ears with many flowers and grains. If the total grain number per ear and the effective grain number increase, the ineffective grain number will increase greatly and the weight of grain and weight of ear will decrease greatly. Therefore, when selecting high-yielding barley varieties, we must solve rationally the contradiction among big ear, heavy grain and grain number in the point of grain's structure, in order to coordinate the three characters and obtain high yield. The data in the trial of barley varieties refer to Table 5.

From Table 5, we can know that high-yielding barley varieties are bigon-style varieties. And the seven characters of these high-yielding barley varieties are as follows: plant height is about 100 cm, length of ear is about 7.5 cm ; one mu has 25x104 ears ; effective grain number per ear is more than 35 ; ineffective grain number is lower than 3 and weight of one thousand grains reaches 35 g ; such the barley varieties, its yield per mu can reach 300kg to 400 kg. From the two trials of comparison of different varieties and evaluation of new lines at the Agricultural Science Research Institute of NanChong, three barley varieties, 8902, 87-513 and 87-5314, have potential as high-yielding barley varieties.
References
[1] Gao Zhiren, Quantity Genetics, Sichuan University Press, 1986.
[2] Sheng Zhilian, Foundation of Mathematics Genetics, ScientificPress.
[3]Tang Shouzheng, Methods of Multivariate Statistics Analysis, Forestry Press of China, 1986.
[4] Zhang Quande, etc, Statistics Pattern and Basic Program of Agricultural Experiments, Scientific and Technological Press of Zhejiang, 1985.
[5] Hays William L., Statistics Third Edition, Holt-Saunders, Japens Ctd, 1981.
[6] Snedecor, George W and G. Cochran, Statistical Methods, the lowa State University Press, 1980.