
The NABGMP is an international, collaborative effort whose primary objectives are (i) development of comprehensive barley genome maps using DNA, biochemical, and morphological markers, (ii) identification of quantitative trait loci (QTLs) controlling characters of economic importance in these populations, and (iii) application of mapping data and technology to plant breeding issues of importance to North America.
A population of 150 barley (Hordeum vulgare L.) doubled haploid lines was developed by the Oregon State University Barley Breeding Program for the North American Barley Genome Mapping Projlect (NABGMP). The parentage of the population is "Steptoe"/ "Morex". Steptoe is a high yielding, broadly adapted six-row Coast-type feed barley selected from the cross of "WA3564/"Unitan". "Morex", a midwestern six-row Manchurian-type, is the North American six-row malting quality standard. It was developed at the University of Minnesota from the cross of "Cree/" Bonanza". Seed from a single head of each parent was used to generate the F, A population of 3 10 DH lines was developed from the F~ by the Hordeum bulbosum technique, as described by Chen and Hayes (1989), and the final set of 150 lines was selected at random from this array.
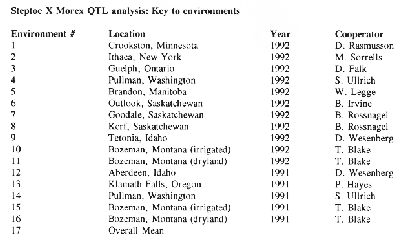
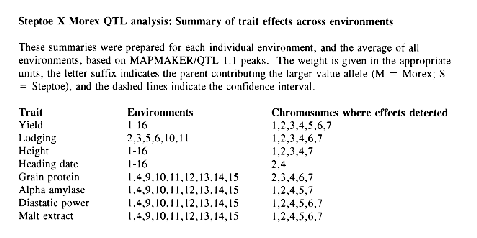
A 295-point linkage map of the barley genome was developed using this population (Kleinhofs et al., 1993). Based on agronomic and malting quality phenotype data generated in five environments in 1991 and a 123-point skeleton linkage map, Hayes et al. (1993) located QTLs for grain yield, lodging %, plant height, heading date, grain protein, alpha amylase, diastatic power, and malt extract in this population (Hayes et al., 1993). In 1992, agronomic phenotypes were assessed in eleven environments, and malting quality traits in five environments, making for a grand total of sixteen environments of agronomic data and nine environments of malting quality data. These extensive phenotype and genotype data sets provide a rich resource for genome analysis.
We have, therefore, prepared a summary of analysis of QTL effects in each environment and averaged over environments. We have employed the 123-point map of Hayes et al. (1993) in these analyses, but the analyses were conducted with MAPMAKER/QTL (Paterson et al., 1988; Lincoln et al., 1992a) rather than QTL-STAT (Liu and Knapp, unpublished). The minimum LOD threshold was specified as 2.0. Our intent in providing this summary is to stimulate the kinds of detailed analyses that this rich data set deserves. We make no pretense that our analyses are definitive. They are merely intended to serve as a guide for additional, more detailed analyses.
To this end, we have arranged the data as online data files on the GrainGenes network Genotype descriptors are presented for each DH line, in MAPMAKER format (Lander et al., 1987; Lincoln et al., 1992b), sorted by chromosome. Marker nomenclature was defined by Kleinhofs et al. (1993) and the locus orders are those presented by Hayes et al. (1993).
Phenotype data are presented for each trait and environment and for the mean across environments. These files are also in MAPMAKER format. The QTL summaries are also available as online data files. Assistance in accessing the online data files on the GrainGenes Gopher Server can be obtained from Dr. David Matthews: matthews@greengenes.cit.cornell.edu, Dept. of Plant Breeding, Cornell University, Ithaca, NY 14853.
Small samples of seed of the Steptoe/Morex doubled haploid germplasm, including parental stocks, may be obtained from Dr. Patrick Hayes, Dept. of Crop and Soil Science, Oregon State University, Corvallis, OR 97331.
References
Chen, F., and P.M. Hayes. 1989. A comparison of Hordeum bulbosum-mediated haploid production efficiency in barley using in vitro floret and tiller culture. Theor. Appl. Genet. 77:701-704.
Hayes, P.M., B.H. Liu, S.J. Knapp, F. Chen, B. Jones, T. Blake, J. Franckowiak, D. Rasmusson, M. Sorrels, S.E. Ullrich, D. Wesenberg, and A. Kleinhofs. 1993. Quantitative trait locus effects and environmental interaction in a sample of North American barley germplasm. Theor. Appl. Genet. 87: 392-401.
Kleinhofs, A., A. Kilian, M. Saghai Maroof, R.M. Biyashev, P.M. Hayes, F. Chen, N. Lapitan, A. Fenwick, T.K. Blake, V. Kanazin, E. Ananiev, L. Dahleen, D. Kudrna, J. Bollinger, S.J. Knapp, B. Liu, M. Sorrells, M. Heun, J.D. Franckowiak, D. Hoffman, R. Skadsen, and B.J. Steffenson. 1993. A molecular, isozyme, and morphological map of the barley (Hordeum vulgare) genome. Theor. Appl. Genet. 86:705-712.
Lander, E.S., P. Green, J. Abrahamson, A. Barlow, M.J. Daly, S.E. Lincoln, and L. Newburg. 1987. MAPMAKER: An interactive computer package for constructing primary genetic linkage maps of experimental and natural populations. Genomics 1: 174-18 1.
Lincoln, S., M. Daly, and E. Lander. 1992a. Mapping genes controlling quantitative traits with MAPMAKER/QTL 1.1. Whitehead Inst. Tech. Rep. 2nd ed.
Lincoln, S., M. Daly, and E. Lander. 1992b. Construction of genetic maps with MAPMAKER/EXP 3.0. Whitehead Inst. Tech. Rep. 3rd ed.
Paterson, A., E. Lander, S. Lincoln, J. Hewitt, S. Peterson, and S. Tanksley. 1988. Resolution of quantitative traits into mendelian factors using a complete RFLP linkage map. Nature 335:721-726.
1The genotype and phenotype data that made these analyses possible were developed by a consortium of researchers in the U.S. and Canada (the NABGMP). Please see the description of the NABGMP in this voulme for a complete listing of participants.

