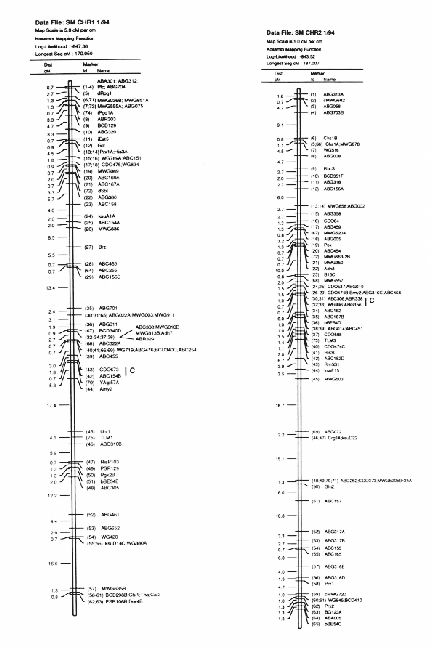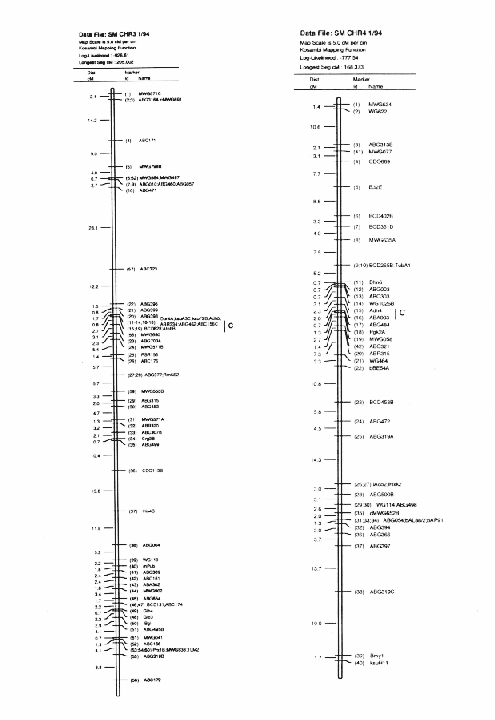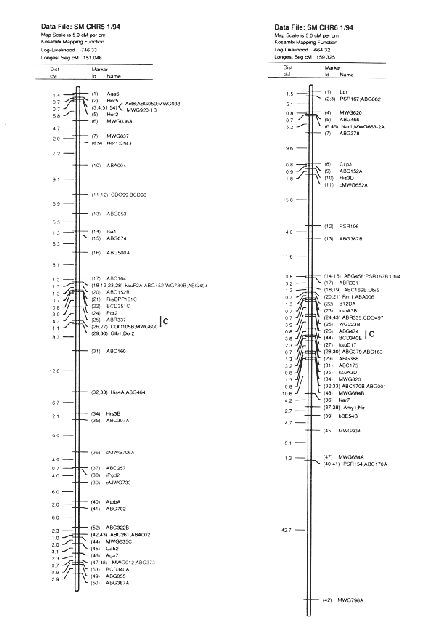

This study was initiated to investigate quantitative trait loci (QTL) for important economic traits in two-row barley (Hordeum vulgare L.). A "sister study" based on a six-row barley population has also been reported (Hayes et al. 1993; see also Hayes et al., this issue).
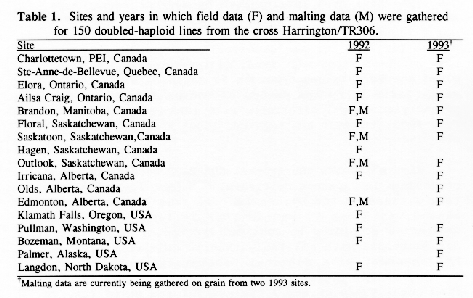
Methods: A population of 150 doubled-haploid (DH) lines was generated from the cross Harrington × TR306. Field data for each line were gathered in 1992 and 1993 at up to 17 sites (Table 1) giving up to 30 environments for each trait. Lines were evaluated in unreplicated plots (1992) or in two randomized complete blocks per site (1993). Data for malting traits were gathered for lines grown at 4 of these sites (Table 1) in 1992.
For each trait, analysis of variance was performed across environments. Line effects were tested against line-by-environment interaction. Data within each environment were then standardized to a common mean (0) and variance (1), and data for each line were averaged across environments. This resulted in an array of 150 dphenotypic observations (one observation per line) for each trait.
Molecular marker analysis of the 150 DH lines was performed concurrently with the phenotypic observations. Over 180 markers (mostly RFLP) were mapped to 7 chromosomes (see Kasha et al., this issue). A subset (52) of these markers was chosen to give a skeletal map with a relatively uniform marker density (approximately 25 cM between markers; Table 3). Arbitrarily, the Harrington genotype was coded as "1" and the TR306 genotype was coded as "0". Missing genotypes (211 out of 7589) were assigned a code between 0 and I based on the probability that a Harrington allele was present (computed from the nearest non-missing marker genotypes). This gave a 150 × 52 matrix of coded marker genotypes. A second matrix was produced to represent the genotypes of each chromosome interval bounded by two flanking skeletal-markers. Marker intervals were coded as ½(M1+M2), where M1 andM2 represented the codes of the flanking markers. The concatenation of these two matrices gave a 150 × 96 matrix representing the genotypes of skeletal markers and skeletal marker-intervals in 150 DH lines.
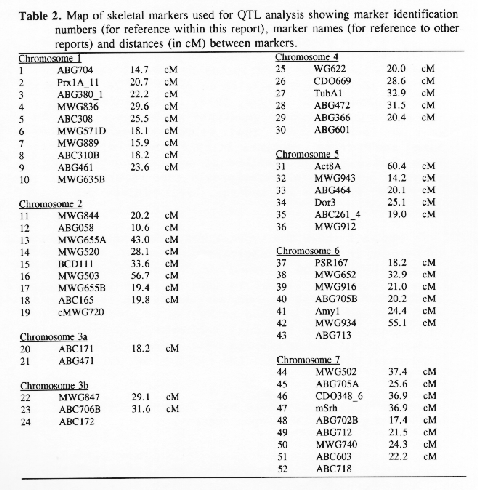
The presence and effects of QTL were inferred by multiple linear regression (MLR). The phenotypic observations for each trait were considered as dependent variables, and the 150 × 96 genotypic matrix was considered to contain independent variables. Stepwise MLR was performed in the SAS statistical package using "PROC REG" with the option "SELECTION=MAXR". For each trait, a model was selected having the largest possible set of regressors with significant marginal effects (P<0.001).
Results and Discussion: Analyses of variance (not shown) gave evidence that there are significant line effects as well as significant line-by-environment interactions for all traits (p<0.001). These tests were made under the assumption that the site-year combinations used in this study are a random sample of barley-production environments in North America. Whether or not these environments are truly random is debatable, but they certainly represent a diverse sample. This being the case, the standardized means of the DH lines represent genetic main-effects that operate over a wide range of environments. This report is concerned with the description of individual loci that contribute to these main effects. Detailed analysis of genotype-by-environment interaction will be the topic of a future report.
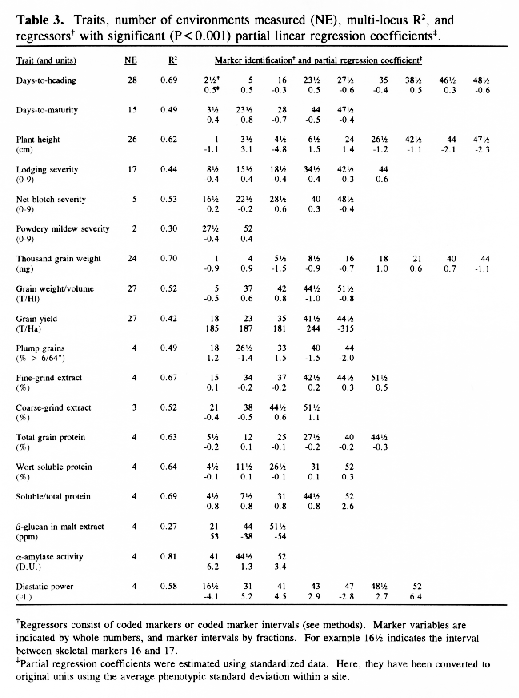
In the selected MLR models, up to nine regressors (markers or marker intervals) were significant for each trait (Table 3). The significance level of 0.001 was chosen to control the experiment-wide error rate at approximately 5% per trait. The amount of variance explained by each model (as estimated by R1) ranged from 27% to 81 %. Lower R2 values may result from higher amounts of environmental variance and/or GxE interaction, but they may also result when there are a large number of QTL with small effects that are not accounted for by the regression model. The high R2 values for traits such as alpha-amylase activity and thousand-kernel-weight indicate that most of the main effects in these traits are accounted for by the selected regressors.
Each of the selected regressors is likely to be associated with a QTL. The positions of these regressors give estimates of QTL locations, and their partial regression coefficients give estimates of the magnitude of the effects of the segregating QTL alleles. These estimated positions and effects are depicted in Figure 1. The size of the confidence interval a QTL position depends on the magnitude of the QTL effect. It also depends on the amount of residual variance for the trait. For traits with a high R2, and for QTL with large effects (such as the alpha-amylase effect at marker 41), the confidence interval is probably less than one marker interval. In the case of alpha-amylase, marker 41 is probably the exact QTL position, because this marker is visualized using a c-DNA probe. For the smaller QTL effects, it is reasonable to assume that the QTL might lie in one of the marker intervals that is adjacent to the position of the regressor. As a general rule, the confidence interval for a QTL effect is about the size of the smallest effect detected for that trait.
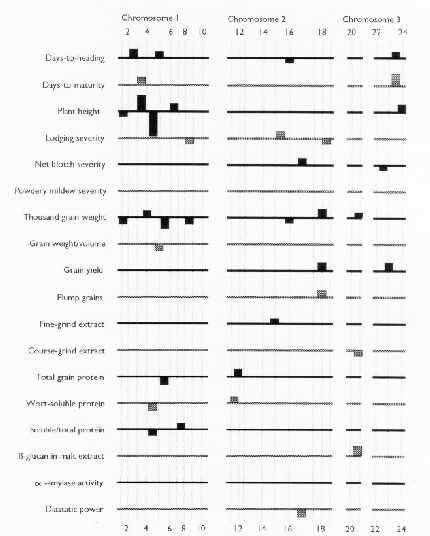
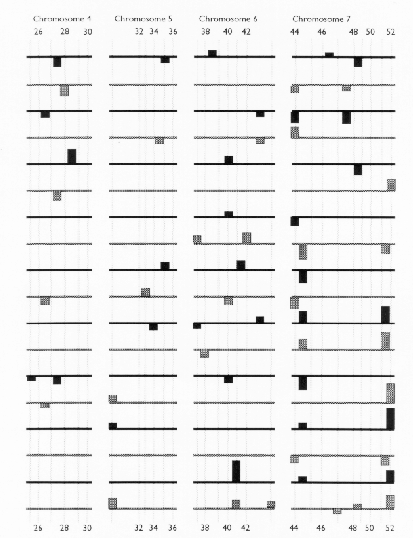
Previously, this same data was analyzed using only the genotypes of the skeletal markers as regressors (Tinker et al. 1994). The present report presents a refinement of this technique, so it is interesting to note some of the similarities and differences that we observed. In most cases, the positions of the QTL estimates have remained the same, or else they have moved from a marker to an adjacent marker interval. Now, the number of regressors that represent markers is 49, and the number of regressors that represent intervals is 50; giving a total of 99 putative QTL. Previously, we detected 86 QTL for the same set of traits. The increase in the number of QTL estimates may be partly due to a slight increase in the experiment-wide error rate (due to the larger number of regressors from which to select). But it may also be an indication that the present technique is more powerful. Sometimes, marker intervals gave more information than individual markers, so they were included in a model when neither of the flanking markers were significant. Also, when a marker interval gave a better fit than a flanking marker, the reduction in residual variance allowed the entry of new regressors into the model. One striking example is the new model for plant height; it contains two adjacent marker intervals with large QTL effects in repulsion phase (3½ and 4&fract12;) that were undetected in the previous report. This, together with another newly detected effect, raised the R1 value from 50% to 62%. In some cases, however, the number of regressors decreased. In the first report, there were 8 instances where two adjacent markers were both selected as being significant. In the present report, all of these adjacent pairs have been replaced by the marker intervals which they bracketed. This suggests the presence of a single QTL where previously we suspected that there could have been two.
The QTL effects estimated here are specific to the average genetic background in this cross; different QTL may be polymorphic in other crosses. Nevertheless, knowing the approximate location and effects of these QTL brings a number of possibilities: it can lead to finer mapping in specific areas of interest and it can permit comparison with the location of QTL that are detected in other studies. This will help breeders and evolutionary geneticists to understand the nature of quantitative trait variation. These QTL affect barley performance across a wide variety of North American environments. Allelic variation at these loci was detected in a relatively elite breeding population and, for most traits, favourable alleles were donated by both parents. This result has positive implications for plant breeders, who aim to produce superior crop varieties that show stable performance across environments. In future studies, we will test the feasibility of using this information in marker-assisted selection - the recovery of segregants with high proportions of favourable QTL alleles.
References
Hayes, P.M., B.H. Liu, S.J. Knapp, F. Chen, B. Jones, T. Blake, J. Franckowiak, D. Rasmusson, M. Sorrells, S.E. Ullrich, D. Wesenberg, A. Kleinhofs (1993) Quantitative trait locus effects and environmental interaction in a sample of North American barley germ plasm. Theor. Appl. Genet. 87:392-401.
Tinker N.A., D.E. Mather, NABGMP (1994) Loci that affect quantitative traits across multiple environments in a two-row barley population. In: Plant Genome 11, The Second International Conference on the Plant Genome, San Diego, Final Program and Abstracts Guide p 66.
Barley genome mapping of the North American Barley Genome Mapping Project (NABGMP) is based on three crosses derived from four parents. These are Steptoe × Morex, Harrington × TR306 and Harrington × Morex. The Steptoe × Morex cross data is reported here.
The Steptoe × Morex maps and description of the first 385 markers was published in BGN 21 & 22. A 295 marker map was published in Theoretical and Applied Genetics 86:705, 1993. Here we present updated (2/'94) Steptoe × Morex map (Figs. 1-7).
Acknowledgments
The authors listed are members of my laboratory who assisted in compiling data and preparation of maps. Mapping data, used to prepare these maps were contributed by many members of NABGMP. Special thanks to Dr. Andreas Graner for providing many excellent probes from their barley mapping program and to Dr. Brian Steffenson for providing spot blotch disease resistance data.
