
Our objectives were (1) to develop a medium density (10 cM) map of barley chromosomes, and (2) to locate quantitative trait loci (QTL) for agronomic and quality traits. Initially, two crosses were planned between leading malting and non-malting barley parents. The first cross, Steptoe × Morex (SM), has been extensively mapped (Kleinhofs et al. 1993, TAG 86:705-712; see also Kleinhofs et al., this issue) and contains 426 markers. Here, we report on the progress of the second cross, Harrington × TR306 (HT). Harrington is the two-row malting quality standard in Canada, and TR306 is a high-yielding non-malting line. Our intention with this cross was to develop a map that was suitable for QTL analysis. For this reason, HT has not been mapped as extensively as SM.
Materials and Methods: A single plant of each parent was grown to make the cross. From F, plants, doubled-haploid (DH) plants were produced by the Bulbosurn Method. The Bulbosum Method was chosen over anther culture to avoid, as much as possible, somaclonal variation and distorted segregation ratios that occur more frequently with the latter. From the large numbers of DH so produced, 150 were randomly chosen to use for mapping and for collection of agronomic and quality data. The linkage map was produced by Kleinhofs using G-Mendel (Liu and Knapp, 1990, J. Hered. 81:407). RFLPs, isozymes, and disease resistance loci were mapped. The RFLPs represent cDNA and genomic clones from barley, wheat and oat, as well as some known function genes.
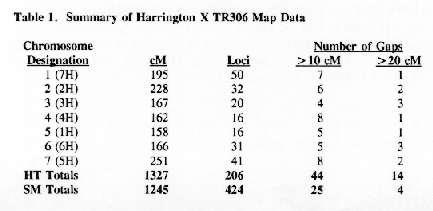
Results and Discussion: The figures here show linkage maps of seven barley chromosomes on which markers have been mapped in the HT cross. A summary of the results is presented in Table 1. A total of 206 markers have been mapped,, providing a total map length of 1327 cM. This is slightly shorter than the total length mapped in the SM cross (see Kleinhofs et al. this issue). A total of 96 loci are are common to both the HT and SM maps. A number of markers distributed across the HT maps have been selected for QTL analysis (see Tinker and Mather, this issue).
Acknowledgements: Financial support was provided by USDA-CSRS Special Grants, NSERC Strategic Grants, Brewing and Malting Barley Research Institute, Agriculture Canada/NSERC Matching Grants, barley growers, the seed trade, and the malting and brewing industries.

 HT CHR1 |  HT CHR2 |
 HT CHR3 |  HT CHR4 |
 HT CHR5 |  HT CHR6 |

| HT CHR7 <-- |