
In mutation breeding programs it is a very common experience that mutations result in a spectrum of phenotypic changes, positively or negatively or both, due to the pleictropic action of the mutated genes or the additional mutational effects on an individual plant. Therefore it is not easy to analyBe the induced variation in quantitative characters individually. Consequently in utagenic variation in a mutant population, several traits should be simultaneously considered and multivariate statistical methods should be used. Considering several traits simultaneously requires that the dimensionality of the data set be reduced. Factor analysis is designed to do this (Godshalk and Timothy 1988). It is a multivariate statistical method that can be successfuly utilised in understanding the patterned variation in a set of variables based on the structural relationships among them (Walton 1971; Lee and Kaltsikes 1973; Cagirgan and Yildirim 1990). It was aimed, in this study, at identifying and comparing patterns of agronomic and morphophysiological characters in the control and macromutant populations of Quantum' barley.
Fifty control plants and 42 potential mutants selected visually from the M2 of two-rowed spring barley variety(Quantum) treated by gamma-rays of 15 and 30 krads were grown in two separate randomised complete blocks design as M3 in a semi-arid environment, Tokat, Turkey. Each plot consisted of one row of 1 m length, 0.3 meter apart and 20 seeds sown. Normal agronomic practices were applied for growing barley. The 16 quantitative characters measured in three plants per plot or as plot value were as follows: Biological yield (g/m), grain yield (g/m) harvest index (%), number of spikes/m, florets/spike, kernels/spike, 1000 kernel weight (g), spike density (%), fertility (%), flag leaf length (mm) , f lag leaf width (mm) , f lag leaf area (mm-) , f lag leaf sheath length (cm), days to heading (after 31 March), plant height (cm), spike length (mm). Values for each of the characters measured in the control and macromutant populations were averaged over each plot and then both sets of the data were subjected to factor analysis discussed earlier by Cattell (1965).
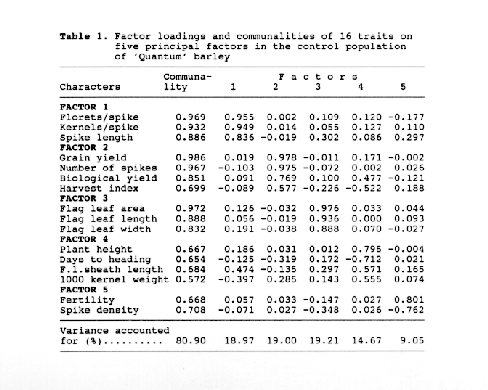
The 16 characters measured in the control population were grouped into five factors (patterns) (Table 1). Together these five factors accounted for 80.90 % of the variance for the sixteen correlated traits. The communalities accounted for by all factors taken together were between 0.572 (1000 kernel weight) and 0.986 (Grain yield). Factor 1, which explained a 18.97 % of the variability in the original set of characters, was composed of spike characteristics', thus it may be named as spike or kernel factor'. Factor 2 is apparently a 'yield factor' since it included grain yield itself, and its most stricking correlated characters such as number of spikes, biological yield and harvest index. Factor 3 explained 19.00 % of the total variability and consisted of three flag leaf lamina characters. Factor 4 can be called as 'kernel weight factor' since it contained a classical yield component, 1000 kernel weight, with its most related characters such as plant height, flag leaf length and days to heading, of which the latter had negative signed loading, suggesting a reverse relationship between them. Fertility and spike density were placed in Factor 5 with opposite signed loadings, and this factor accounted for 9.05 % of the total variability in the control population.
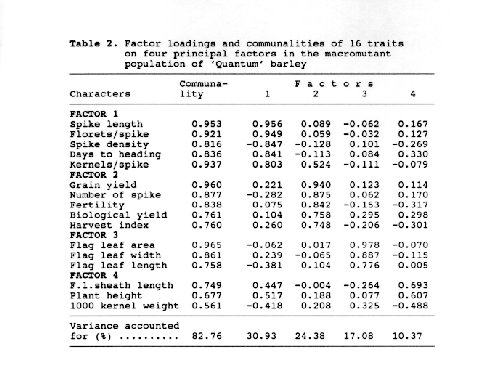
Contrary to the control population, four factors were enough to cover the entire variation of sixteen traits in the macromutant population. All four factors explained 82.76 % of the variability of the 16 traits, which is higher than the five factors in the control population do. Also there were clear differences in magnitudes of the variances accounted for each factor between the two population. The differences in the number of factors extracted and the factor components between the two population were due to the fact that the populations were not identical, as expected. Finally it was concluded that factor analysis may be succesfully used in order to identify the patterned variation caused by pleiotropic gene action, linkage, etc., and to compare the characters patterns between the populations.
References
Cagirgan, M.I. and M.B. Yildirim. 1990. An application of factor analysis to data from control and mutant populations of "Quantum" barley.
J.Fac.of.Agri. of Akdeniz Univ. 4:125-138 (Summary in English). Cattell, R.B. 1965. Factor analysis: An introduction to essentials I. The purpose and underlying models. Biometrics 21:190-210.
Godshalk, E.B. and D.H. Timothy. 1988. Factor and principal component analyses as alternatives to index selection. Theor. Appl. Genet. 76:352-360.
Lee, J. and P.J. Kaltsikes. 1973. Multivariate statistical analysis of grain yield and agronomic characters in Durum Wheat. Theor. Appl. Genet. 43:226-231.
Walton, P.D. 1971. The use of factor analysis in determining characters for yield selection in wheat. Euphytica 20:416-421.

Table 2. Factor loadings and communalities of 16 traits on four principal factors in the macromutant populations 'Quantum' barley
