III. 1. Theoretical segregating ratios in telotrisomic analysis. (1)
T. Tsuchiya, Department of Agronomy, Colorado State University, Fort Collins, Colorado 80523, U.S.A.
(1) Supported by USDA/SEA-CSU Cooperative Research Grant 58-OAHZ-2-265.
The theoretical segregating ratios were presented by Reeves et al. (1968) in genetic analysis with telosomic, secondary, tertiary trisomics and other trisomic types in which the extra chromosome carry a deficiency and/or duplication-deficiency.
Based on their work (Reeves et al., 1968), the present author illustrated the segregating ratios on various occasions. However, in calculating the ratios in the total population, transmission rate was not considered and resulted in erroneous figures (Tsuchiya and Singh, 1982).
In this article the present author will make correction for the erroneous part of the illustration placed in the paper by Tsuchiya and Singh (1982).
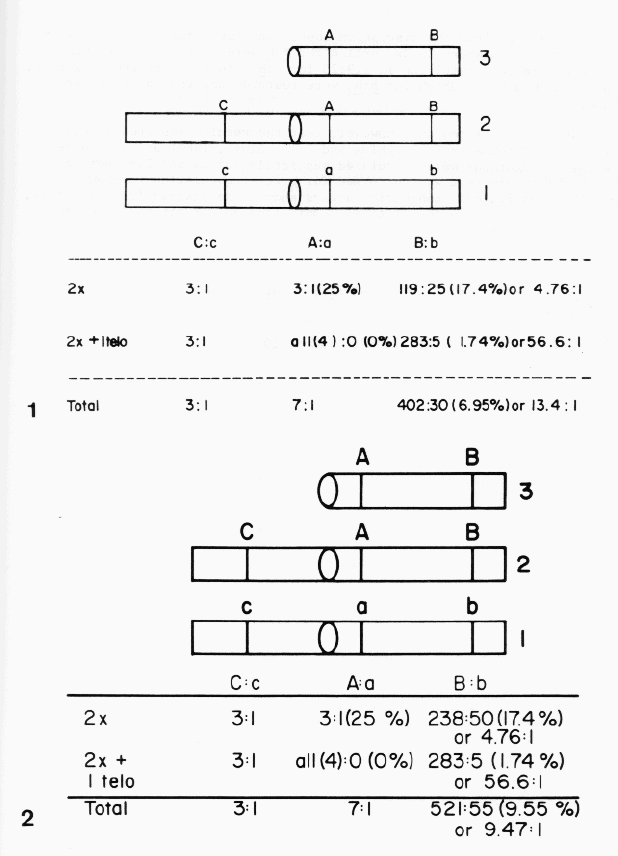
Figure 1 on page 203 in Volume 61 of Theoretical and Applied Genetics (1982) is correct except the "Total" figure for B:b. The authors (Tsuchiya and Singh, 1982) studied chromosome number of every single plant in an F2 population and the segregation ratios were calculated separately for 2x portion and 2x+1 telo portion. Therefore, the ratios in each portion are correct; 3:1 (25%) for A:a in 2x portion and all(4): 0 (0%) for A:a in 2x+1 portion. In this case even a total is correct based on 50% transmission of the extra telocentric chromosome. The main problem is the calculation of a total for the Bb pair, although the segregation ratios in each of 2x and 2x+1 portion are correct; 119:25 (17.4%) or 4.76:1 for B:b in 2x portion and 283:5 (1.74%) or 56.6:1 in 2x+1 portion. However, in calculating the segregation ratio in 2x portion, the number was divided by 2 and resulted in 119:25 (17.4%) instead of 238:50 (17.4%). When the segregation ratios for 2x and 2x+1 portions are calculated separately, there is no problem since the percentage of the recessive plants in 2x portion is the same 17.4% regardless of actual number (119:25 or 238:50). However, in calculating the total figure, an adjustment should be made to double the actual number; from 119:25 to 238:50. Thus the segregation in a total population should be 521B:55b and the ratio should be 9.47B:lb or 9.55% of the F2 population should be recessive homozygotes for b. These figures are different from the erroneous calculation of total figures (402B:30b or 13.4B:1b) or 6.9% recessive homozygotes in Tsuchiya and Singh (1982).
It is obvious from the discussion above that the error originated from the fact that the numbers in 2x portion for B:b were divided by 2 to make the figures smaller, resulting in 119:25 for B:b. In the corrected Figure 2, the original numbers, 238:50 for B:b, were restored and the total numbers changed.
It should be pointed out, however, that the results reported in our paper (TAG 61:201-208 by T. Tsuchiya and R. J. Singh, 1982) are all correct since the segregations were calculated separately for 2x and 2x+1 portion although chi-Square test was performed for a total population to show mainly that noncritical combination always showed the disomic (3A:1a) ratios, but the actual ratios in the critical combination do not fit the expected ratios in some cases.
Reference:
Reeves, A. F., G. S. Khush and C. M. Rick. 1968. Can. J. Genet. Cytol. 10:937-940.
Tsuchiya, T. and R. J. Singh. 1982. TAG 61:201-208.