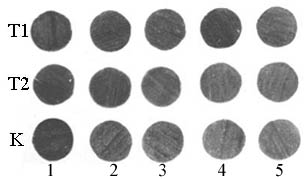
Fig. 19. Determination of paraquat sensitivity in the leaves of transformed and control plants of Tulunskaya 12 wheat. K, control plant; T1 and T2, transformed plants. Paraquat concentrations are 1, 0 mM; 2, 0.125 mM; 3, 0.250 mM; 4, 0.5 mM; and 5, 1 mM.