Argentina
Laser technique to screen embryo activity in barley seeds.
C. Weber1*, G. H. Sendra1,2 , M. Trivi1, H. Rabal1, R. Arizaga1 , J. C. Salerno3.
1 Centro de Investigaciones Opticas (CIC- CONICET) and UID Optimo, Facultad de Ingeniería, Universidad Nacional de La Plata. Casilla Correo 124, 1900 La Plata, Argentina.
2 Laboratorio Láser, Facultad de Ingeniería, Universidad Nacional de Mar del Plata, Juan B. Justo 4302, 7600 Mar del Plata, Argentina.
3 Instituto de Genética “IGEAF”. Instituto Nacional Tecnología Agropecuaria (INTA).Casilla Correo 25, 1712, Castelar, Argentina.
*Corresponding author: C. Weber e-mail: cweber@ciop.unlp.edu.ar.
Abstract
In this paper we present the application of a new methodology (Laser Biospeckle) to the study of barley (Hordeum vulgare L.) seeds. A brief description of the speckle phenomena and the used algorithm are discussed. We find that it is possible to characterize the biological activity of the seed. The activity of the embryo can be distinguished from that of the endosperm. Experimental results are shown. Biospeckle could be a potential methodology to assess viability, dormancy detection and water sensitivity in barley seeds.
Key words: barley’s seeds activity, laser biospeckle, germination.
1. Introduction.
Barley (Hordeum vulgare L) is one of the cultivars with wider World diffusion. It occupies the 4th place after wheat, maize and rice. Europe is the principal producer as it supplies the 43% of the World production. The MERCOSUR (Economic Community of South America) produces 1.236.248 Tn., the 0.87 % of World production, being Argentina the principal supplier with 1.000.000 Tn. per year (years 2004/2005). Total World commerce is about 15,3 mill. Tn., corresponding specifically 5.1 mill. Tn to beer barley.
Its grain is a caryopses sharpened at its two endings, usually dressed by the glumelas. Has lower protein content than other winter cereals. As well as the barley grain can be used for several purposes, doubtless it principal use is in the elaboration of malts for the beer industry. To that end it has to fulfil the following features: germinative energy not lower than 85 %, low protein content, high content of starch, good diastasic power to transform starch into maltose and uniform grain size.
Barley seeds have a variable sensitivity to water that produces several problems in the malting process. This sensitivity produces slow and not uniform germination when seeds are incubated in water excess. There is a close relation between water excess and dormancy phenomena.
Several tests have been developed to assess seeds viability under different moisture conditions. (AOSA 1983) These methods require one or several days for the final diagnosis.
Some of us have developed an approach to study seeds activity using a laser speckle technique named “biospeckle” (Braga et al., 2003). In that work we characterized embryo and endosperm of corn seeds and proposed the biospeckle technique as a potential methodology for test viability.
In this paper, we present an application of the method to the study of barley seeds.
We intend mainly to observe the activities of the embryo and the endosperm regions.
We found that the activity of the embryo can be distinguished from that of the endosperm.
We applied this technique to a set of vigorous seeds and found different degrees of activity presumably attributed to different origins in each sample under study.
One non viable seed was also detected.
Preliminary results with this methodology are shown here to demonstrate that barley seeds have a similar behavior to that of corn seeds.
Advantages of the speckle method are discussed. The technique can be extended to applications in other biological samples.
2. Description of the speckle phenomena
When a coherent light source illuminates a non polished surface, the surface roughness causes interference phenomena consisting in randomly distributed bright and dark points: the so called speckles, originated by the different path lengths among different points in the surface and the detector pixels. Each surface shows a peculiar speckle pattern that depends on its roughness, on the incoming light wavelength and on the aperture of the imaging optical system. Fig. 1 shows a typical speckle pattern. During a slow movement, upon suitable optical conditions, the pattern is preserved and can be recognized in successive images, but in biological samples presenting surface activity, the pattern varies rapidly (Aizu and Asakura, 1996; Briers, 1993; Okamoto and Asakura, 1995). The scattered intensity distribution along time can be used to characterize the degree of activity in a process.
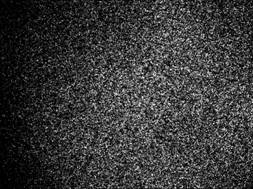
Fig. 1. A speckle pattern.
Recently, we proposed a method (Sendra et al., 2005) to analyze the biospeckle activity based in the decomposition of images series in temporary spectral bands. It permits to obtain several measures in different time scales, thus adding to a more detailed characterization of the behavior of the samples.
3. Materials and methods
In this study we employed a set of 20 high germinative energy and germinative power barley seeds. Biospeckle technique in barley seeds was tested using the following methodology:
The set was randomly divided in two sub sets of 10 seeds each. They were kept during 24 hours in 90 mm diameter Petri boxes, soaked in distilled water using moisture germination paper at 22º C temperature to start germination process and maintained in dark environments.
After that, 5 seeds with incipient very small radicles were selected for biospeckle experiments.
The remaining seeds, all but one showing also incipient radicles, were left to continue with the germination process. The selected 5 seeds were left on blotting paper to remove water excess.
Then they were transversally cut along their major axis using a cutter to expose the embryo, as in the TZ test, and illuminated by a laser beam.
After 72hs we detected that only one seed of the control set did not germinate while the others showed noticeable radicles. That seed was also processed with the biospeckle method using the same procedure to assess its behavior.
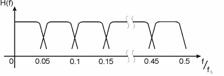
Then the seeds were illuminated with an expanded and attenuated 10 mW He-Ne laser. (l=633 nm). By using a CCD camera as detector and a host computer with a frame grabber, the successive sample images were registered, digitized to 8 bits and stored. Care was taken so that speckles were well resolved by the CCD sensor. We used very low illuminating intensity to minimize the effect of the irradiation on the sample activity. Mean laser illumination was kept constant during all measurements and no appreciable changes in sample reflectivity were observed. 400 images, 512 x 512 pixels size, of each sample were registered at 1 sec intervals thus corresponding to a sampling frequency fs of 1 Hertz. Every set of images corresponding to one sample was processed by applying to it the time spectral bands algorithm. (Sendra et.al, 2005) (See Fig. 2).
The signal corresponding to the evolution of every pixel was used as input to a bank of filters. A normalization procedure was applied to each signal before its filtering. It consisted in subtracting its temporal mean value and then dividing the result by the same temporal mean value. This procedure minimizes local differences in reflectivity or illumination of the object. The maximum frequency that can be adequately analyzed is determined by the sampling theorem and is a half of the sampling frequency fs (Oppenheim, 1975). This last one is set by the CCD camera, the size of the image, and the frame grabber. Therefore, the bank of filters used in this study is composed of ten 5º order Butterworth filters (Oppenheim, 1975) covering all the frequency range up to the half of the sampling frequency fs , as it is outlined in Figure 1. The bank was implemented in a computer using MATLAB® software. We chose the Butterworth filter because, in addition to its simplicity, it is mostly flat.